FEDS Notes
October 14, 2020
Macroeconomic news and stock prices over the FOMC cycle
Jack McCoy, Michele Modugno, Dino Palazzo, and Steve Sharpe
1 Introduction
We develop novel macroeconomic surprise indexes to identify the impact of macroeconomic releases on aggregate stock market returns over the FOMC cycle. We find that aggregate stock prices are positively correlated with our real economic activity news index and negatively correlated with our price news index. We show that our aggregate indexes are able to explain about 20% of the variation in FOMC-period stock market movements, a good deal more than the stock market returns explained by the Citigroup US Economic Surprise Index (CESI), a commonly used index of macroeconomic surprises.
2 Methodology
Our macroeconomic surprise indexes are a weighted average of macroeconomic surprises, where surprise is defined as the difference between the realized value of the macroeconomic release and the median (a.k.a. consensus) of the forecasts made by a panel of market participants and collected by Bloomberg Economic Calendar (ECO). Those forecasts can be submitted one to two weeks before each release and can be updated at any time until the official release, making them a very plausible representation of market participants beliefs in real-time. In order to express all of data surprises in comparable units, each data surprise series is normalized by its historical standard deviation.
Our index is constructed using up to 94 surprise series on macroeconomic variables separated into two groups: 69 economic activity variables (production, consumption, sales, labor, activity surveys, etc.), and 25 price variables. Over time, the set of available consensus forecasts on Bloomberg expanded, as exhibited in Figure 1. Table A.1 and Table A.2 report the components of the activity and price series, the date the consensus forecast was first available in Bloomberg, the number of observations in our sample, the data series frequency, and its most recent relevance index. The relevance index is the percentage of Bloomberg users that set up an automatic alert to be notified when the figure for a given macroeconomic variable has been released. This index provides a gauge of the relative importance of a release to market participants, which we use to weight the news components within an FOMC period before aggregating them.
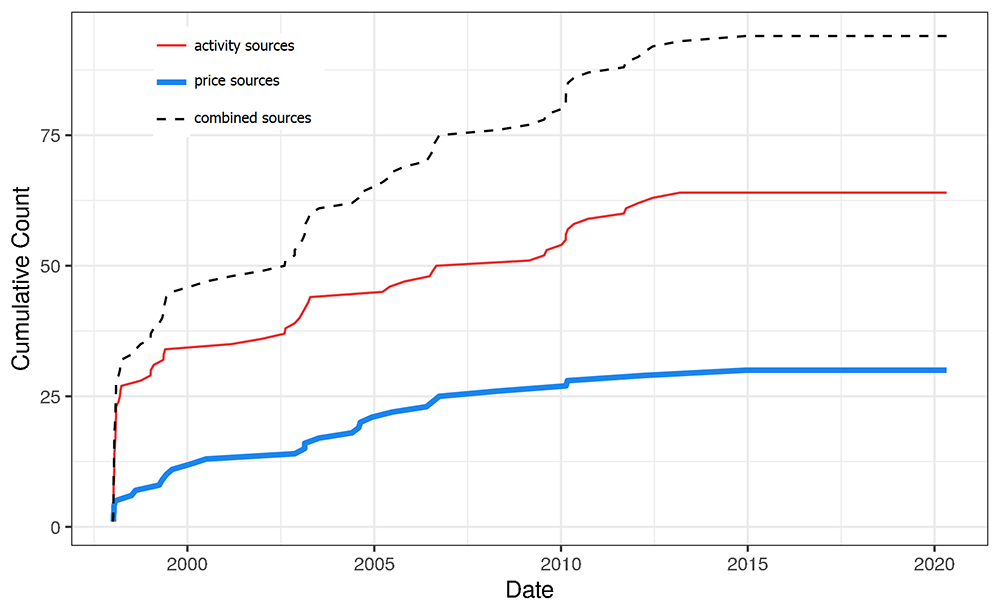
As is evident in the figure, the set of macro news sources increased steadily from 2000 to 2013, and has remained relatively consistent since.
Source: Bloomberg Finance LP, Bloomberg Terminals (Open, Anywhere, and Disaster Recovery Licenses); and Bloomberg Finance LP, Bloomberg Per Security Data License.
Our activity news index $$ani$$ at daily frequency is thus calculated as:
$$$$ {ani}_t = \sum_{i=1}^{N_{a,t}} s_{i,t} w_{i,t} = \sum_{i=1}^{N_{a,t}} \frac{ (A_{i,t} - M_{i,t}) }{ {std}(A_{i,t} - M_{i,t}) } \frac{ W_{i,t} }{ \sum_{i=1}^{N_{a,t}} W_{i,t} } $$$$
Where $$N_{a,t}$$ is the number of activity variables available at time $$t$$, $$s_{i,t}$$ is the surprise in day $$t$$ for activity variable $$i$$, and $$w_{i,t}$$ is the relative importance for activity variable $$i$$. The relative importance of variable $$i$$ is equal to its relevance at time $$t$$ ($$W_{i,t}$$) divided by the sum of the relevance values of all the activity data releases at time $$t$$. The price news index $$pni$$ is calculated in a similar fashion. Using the relevance index to weight the importance of each series allows us to have an expanding set of series underlying the indexes, overcoming the need of working with a balanced panel of data as in Altavilla et al. (2017), whose weights are obtained within a 2-step regression framework.1
Figure 2 reports an 8-FOMC [8-meeting] moving average of the two news indexes, alongside the moving-average of CESI, again, one of the more widely-used time-series indicators of economic news.2 Our activity and price news indexes each identify periods of persistent weaker-than-expected and stronger-than-expected news. In particular, activity in the U.S. was persistently weaker than expected around the beginning of the financial crisis and during the 2014-2015 economic slowdown. Periods of persistent stronger-than-expected activity are evident during the recovery from the financial crisis and during the reacceleration of activity over 2016-2018. Turning to prices, we have periods with persistently higher-than-expected prices during the commodity price boom leading up to the financial crisis, as well as during 2011. Each of those episodes is then followed by a period of persistently lower-than-expected price inflation.
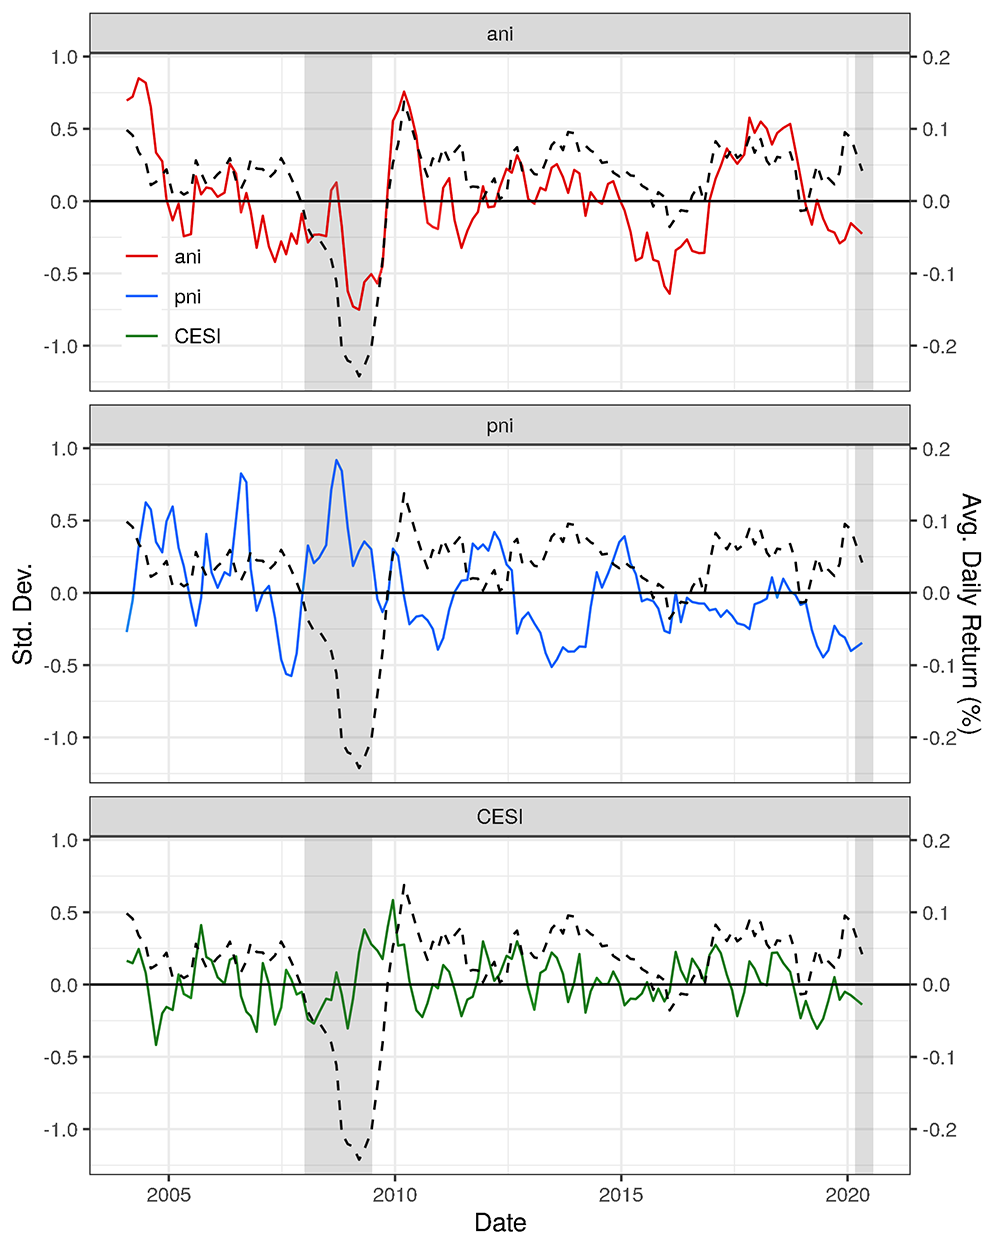
This figure plots the 8-FOMC moving average of our two macro news indexes and the CESI for US. We aggregate the daily $$ani$$ and $$pni$$ as the mean surprise over the inter-FOMC period and CESI as the average daily change over the same period, then scale each variable to a mean of zero and standard deviation of one. We take the 8-period moving average here to reflect the average number of FOMC meetings for each year, smoothing out seasonal fluctuations. The left axis shows the standard deviation of each index, and the right axis shows the corresponding smoothed average daily return of the S&P 500 over the intermeeting period, in percent (dashed line).
The shaded bars indicate periods of business recession as defined by the National Bureau of Economic Research: December 2007–June 2009 and February 2020.
Source: Bloomberg Finance LP, Bloomberg Terminals (Open, Anywhere, and Disaster Recovery Licenses); and Bloomberg Finance LP, Bloomberg Per Security Data License.
3 Results
We use the economic activity news index $$ani$$ and the price news index $$pni$$ to explore the influence of macroeconomic news on the aggregate stock market, measured by the average daily S&P500 return over the inter-FOMC meeting period. The latter quantity is the return from the close of the second day of previous FOMC meeting and announcement to the close of first day of the current FOMC meeting, divided by the number of trading days. We aggregate the news indexes $$ani$$ and $$pni$$ as the sum of daily surprises from the day after the previous FOMC through the first day of the current FOMC, divided by the number of days where index data is available. We focus on this time window in order to abstract from the impact of regular monetary policy announcements on stock prices, and focus only on the surprise components of the macro releases.3 To understand the impact of macroeconomic news on stock returns, we fit the following linear model:
$$$$ {ret}_{m_1} = a + b^\prime x_{m_1} + c\ {ret}_{(m-1)_1} + u_{m_1} $$$$
Where $$x_{m_1}$$ may contain either or both of our news indexes. Note that we also control for the market return of the previous inter-FOMC meeting period. Figure 3 reports the scatter plot of the market return against the different measures of macroeconomic surprises used in the empirical analysis.
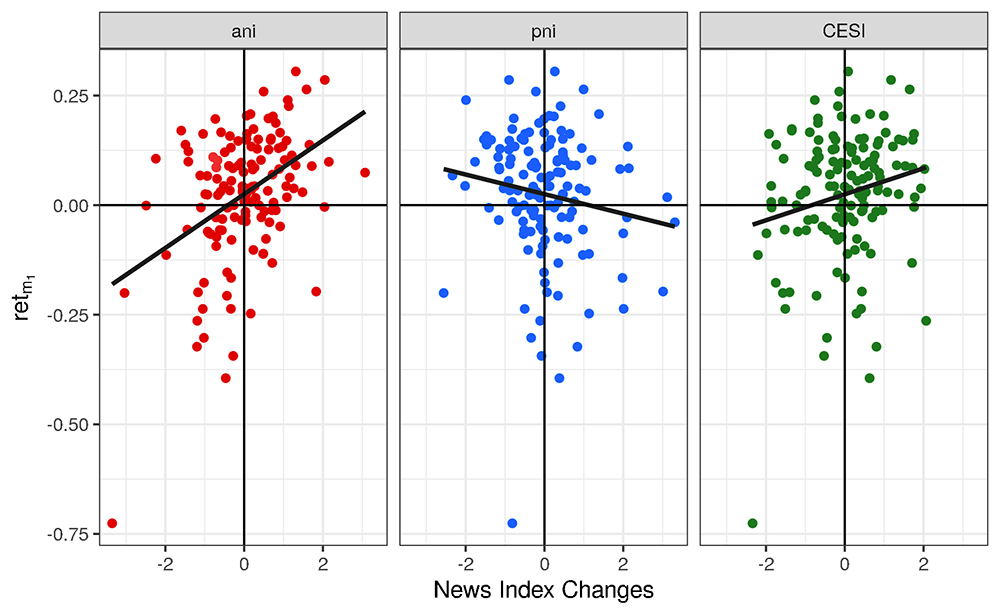
These scatterplots show the relationships between the average daily inter-FOMC S&P 500 returns and the average daily standardized activity news index, price news index, and CESI. The thick black line shows the predicted values from a univariate regression on each. The standardized $$ani$$ has a coefficient of 0.06 with significance at the 1% level and an R2 of 17%; the standardized $$pni$$ has a coefficient of -0.02, with significance at the 1% level and an R2 of 3%; and the CESI has a coefficient of 0.02, with no statistical significance and an R2 of 2%.
Source: Bloomberg Finance LP, Bloomberg Terminals (Open, Anywhere, and Disaster Recovery Licenses); and Bloomberg Finance LP, Bloomberg Per Security Data License.
Table 3 reports the results for a sample of 137 inter-FOMC meeting periods, spanning March 2003 – April 2020. The specification in Column 1, which includes the activity news index, documents that a one standard deviation (unexpected) increase leads to a significant increase in the average daily S&P 500 return of 0.06%. Given the average length of an inter-FOMC meeting period of 33 trading days, this would imply a total S&P 500 increase over the FOMC cycle of about 2%. Moreover, the activity index alone explains about 17% of the stock market variability. In Column 2, we only include the price news index and find a statistically significant relation with aggregate stock market movements that survives when we also control for the activity news index (Column 3). In the latter case, a one standard deviation increase in the price news index leads to a significant decrease in the average daily S&P 500 return of 0.03%, which translates into a cumulative decrease of about 1% over the inter-FOMC meeting period. All told, these results indicate that not only is news about real activity much more important than news about prices in explaining aggregate stock price movements, but also that price news has the opposite sign of activity news: the adjusted R-squared goes from 17% when we only consider the real activity news index, to 20% when we also consider the price news index.
Finally, Table 3 also reports the performances of the CESI, the commonly used index for tracking the trajectory of macroeconomic news surprises and their presumed influence on financial markets. Column 4 shows that, by itself, the FOMC-period change in the CESI has a positive effect on aggregate stock returns, but with only about a third of the explanatory power of our news indexes. Moreover, column 5 shows that CESI has no marginal explanatory power in a regression that also includes our news indexes.
Table 3: Regressions of S&P 500 returns on news indexes
| Dependent variable: | |||||
|---|---|---|---|---|---|
| $${ret}_{m_1}$$ | |||||
| (1) | (2) | (3) | (4) | (5) | |
| $${ani}_{m_1}$$ | 0.06*** | 0.06*** | 0.07*** | ||
| (3.68) | (3.46) | (3.06) | |||
| $${pni}_{m_1}$$ | -0.02** | -0.03*** | -0.03*** | ||
| (-2.20) | (-3.34) | (-3.26) | |||
| $$CESI_{m_1}$$ | 0.03*** | -0.003 | |||
| (2.65) | (-0.23) | ||||
| $${ret}_{(m-1)_1}$$ | 0.08 | 0.18 | 0.04 | 0.18 | 0.04 |
| (0.84) | (1.17) | (0.47) | (1.47) | (0.46) | |
| Constant | 0.02 | 0.02 | 0.02* | 0.02 | 0.02* |
| (1.58) | (1.25) | (1.70) | (1.24) | (1.71) | |
| Observations | 137 | 137 | 137 | 137 | 137 |
| R2 | 0.18 | 0.05 | 0.22 | 0.07 | 0.22 |
| Adjusted R2 | 0.17 | 0.04 | 0.20 | 0.06 | 0.20 |
Each regression uses a sample from the March 2003 FOMC to the April 2020 FOMC. $$ani$$ denotes our activity news index, $$pni$$ our price index, $$CESI$$ the Citi US Economic Surprise Index, and $$ret_{(m-1)_1}$$ the previous inter-FOMC return. In column 3, a combination of the activity and price news indexes with the lagged return gives the highest adjusted R2 of 20%, with highly significant t-statistics denoted below the coefficients.
Note: *p<0.1;
**p<0.05;
***p<0.01
Source: Bloomberg Finance LP, Bloomberg Terminals (Open, Anywhere, and Disaster Recovery Licenses); and Bloomberg Finance LP, Bloomberg Per Security Data License.
4 Conclusion
This note introduces a novel set macroeconomic surprise indexes based on forecasts made by a panel of market participants and collected by Bloombergs Economic Calendar (ECO). These indexes have substantial explanatory power for aggregate stock market movements over the FOMC cycle.
Table A.1: Activity News Index Components
| Variable | First Obs. | # Obs | Freq. | Rel. Index |
|---|---|---|---|---|
| ISM Manufacturing | 1/2/1998 | 269 | M | 95 |
| Factory Orders | 1/6/1998 | 267 | M | 86 |
| New Home Sales | 1/7/1998 | 268 | M | 91 |
| Initial Jobless Claims | 1/8/1998 | 1165 | W | 98 |
| Consumer Credit | 1/8/1998 | 268 | M | 39 |
| Change in Nonfarm Payrolls | 1/9/1998 | 269 | M | 99 |
| Unemployment Rate | 1/9/1998 | 268 | M | 89 |
| Wholesale Inventories MoM F | 1/9/1998 | 260 | M | 81 |
| Retail Sales Advance MoM | 1/14/1998 | 268 | M | 92 |
| Retail Sales Ex Auto MoM | 1/14/1998 | 268 | M | 64 |
| Philadelphia Fed Business Outlook | 1/15/1998 | 269 | M | 80 |
| Business Inventories | 1/15/1998 | 269 | M | 39 |
| Industrial Production MoM | 1/16/1998 | 268 | M | 90 |
| Capacity Utilization | 1/16/1998 | 267 | M | 63 |
| Trade Balance | 1/21/1998 | 269 | M | 84 |
| Monthly Budget Statement | 1/23/1998 | 267 | M | 76 |
| Conf. Board Consumer Confidence | 1/27/1998 | 269 | M | 94 |
| Durable Goods Orders P | 1/28/1998 | 264 | M | 93 |
| MNI Chicago PMI | 1/30/1998 | 269 | M | 82 |
| GDP Annualized QoQ A | 1/30/1998 | 90 | Q | 97 |
| Personal Income | 2/2/1998 | 268 | M | 85 |
| Personal Spending | 2/2/1998 | 267 | M | 85 |
| Leading Index | 2/3/1998 | 269 | M | 83 |
| GDP Annualized QoQ S | 2/27/1998 | 89 | Q | 97 |
| Current Account Balance | 3/12/1998 | 88 | Q | 72 |
| Housing Starts | 3/17/1998 | 265 | M | 89 |
| GDP Annualized QoQ T | 3/26/1998 | 88 | Q | 97 |
| Construction Spending MoM | 10/1/1998 | 257 | M | 80 |
| ISM Non-Manufacturing Index | 1/6/1999 | 255 | M | 79 |
| Change in Manufact. Payrolls | 1/8/1999 | 257 | M | 69 |
| Average Weekly Hours All Employees | 2/5/1999 | 253 | M | 26 |
| Nonfarm Productivity P | 5/11/1999 | 78 | Q | 43 |
| U. of Mich. Sentiment P | 5/14/1999 | 252 | M | 94 |
| U. of Mich. Sentiment F | 5/28/1999 | 253 | M | 94 |
| Nonfarm Productivity F | 3/6/2001 | 74 | Q | 43 |
| Durables Ex Transportation P | 12/28/2001 | 217 | M | 74 |
| Continuing Claims | 8/8/2002 | 886 | W | 69 |
| Building Permits | 8/16/2002 | 213 | M | 62 |
| Empire Manufacturing | 11/15/2002 | 211 | M | 83 |
| Wards Total Vehicle Sales | 1/1/2003 | 208 | M | 43 |
| Personal Consumption A | 1/30/2003 | 69 | Q | 68 |
| Personal Consumption S | 2/28/2003 | 68 | Q | 68 |
| Personal Consumption T | 3/27/2003 | 69 | Q | 68 |
| NAHB Housing Market Index | 4/15/2003 | 206 | M | 46 |
| Existing Home Sales | 3/23/2005 | 183 | M | 88 |
| Pending Home Sales MoM | 6/1/2005 | 181 | M | 76 |
| Richmond Fed Manufact. Index | 10/25/2005 | 175 | M | 71 |
| Existing Home Sales MoM | 6/27/2006 | 168 | M | 49 |
| New Home Sales MoM | 7/27/2006 | 166 | M | 46 |
| ADP Employment Change | 8/30/2006 | 165 | M | 87 |
| Dallas Fed Manf. Activity | 2/23/2009 | 136 | M | 64 |
| Chicago Fed Nat Activity Index | 7/21/2009 | 112 | M | 63 |
| Retail Sales Ex Auto and Gas | 8/13/2009 | 130 | M | 61 |
| Pending Home Sales NSA YoY | 1/5/2010 | 92 | M | 28 |
| Building Permits MoM | 2/17/2010 | 123 | M | 27 |
| Housing Starts MoM | 2/17/2010 | 121 | M | 28 |
| NFIB Small Business Optimism | 3/9/2010 | 122 | M | 62 |
| Change in Private Payrolls | 5/7/2010 | 121 | M | 31 |
| Cap Goods Orders Nondef Ex Air P | 9/24/2010 | 112 | M | 60 |
| JOLTS Job Openings | 9/7/2011 | 98 | M | 24 |
| Kansas City Fed Manf. Activity | 9/29/2011 | 102 | M | 20 |
| Cap Goods Ship Nondef Ex Air P | 1/26/2012 | 95 | M | 59 |
| Manufacturing (SIC) Production | 6/15/2012 | 95 | M | 17 |
| Wholesale Trade Sales MoM | 3/8/2013 | 72 | M | 15 |
This table shows the variables included in the activity news index $$ani$$. Activity series are reported in chronological order. For each series, we report the date the consensus forecast was first available in Bloomberg, the number of observations in our sample, the frequency, and the relevance index. The relevance index is the number of Bloomberg users that set up an automatic alert to be notified when the figure for a given macroeconomic variable has been released.
Source: Bloomberg Finance LP, Bloomberg Terminals (Open, Anywhere, and Disaster Recovery Licenses); and Bloomberg Finance LP, Bloomberg Per Security Data License.
Table A.2: Price News Index Components
| Variable | First Obs. | # Obs | Freq. | Rel. Index |
|---|---|---|---|---|
| PPI Ex Food and Energy MoM | 1/8/1998 | 268 | M | 66 |
| PPI Final Demand MoM | 1/8/1998 | 268 | M | 87 |
| CPI MoM | 1/13/1998 | 269 | M | 96 |
| CPI Ex Food and Energy MoM | 1/13/1998 | 268 | M | 77 |
| Employment Cost Index | 1/27/1998 | 90 | Q | 75 |
| Average Hourly Earnings MoM | 7/2/1998 | 263 | M | 31 |
| Import Price Index MoM | 8/13/1998 | 258 | M | 78 |
| GDP Price Index T | 3/31/1999 | 83 | Q | 77 |
| GDP Price Index S | 4/30/1999 | 82 | Q | 77 |
| Unit Labor Costs F | 6/8/1999 | 81 | Q | 38 |
| Unit Labor Costs P | 8/5/1999 | 82 | Q | 38 |
| GDP Price Index A | 1/28/2000 | 80 | Q | 77 |
| ISM Prices Paid | 7/3/2000 | 239 | M | 74 |
| PPI Final Demand YoY | 11/15/2002 | 195 | M | 68 |
| CPI YoY | 2/21/2003 | 200 | M | 70 |
| CPI Ex Food and Energy YoY | 2/21/2003 | 199 | M | 55 |
| PPI Ex Food and Energy YoY | 7/11/2003 | 191 | M | 65 |
| PCE Deflator YoY | 5/28/2004 | 187 | M | 42 |
| PCE Core Deflator YoY | 8/3/2004 | 188 | M | 50 |
| CPI Index NSA | 8/17/2004 | 184 | M | 37 |
| Import Price Index YoY | 12/9/2004 | 165 | M | 35 |
| PCE Core Deflator MoM | 6/30/2005 | 179 | M | 60 |
| Core PCE QoQ S | 5/25/2006 | 56 | Q | 68 |
| Core PCE QoQ A | 7/28/2006 | 54 | Q | 68 |
| Core PCE QoQ T | 9/28/2006 | 54 | Q | 68 |
| FHFA House Price Index MoM | 4/22/2008 | 145 | M | 69 |
| CPI Core Index SA | 2/19/2010 | 88 | M | 40 |
| Average Hourly Earnings YoY | 3/5/2010 | 123 | M | 32 |
| PCE Deflator MoM | 3/30/2012 | 98 | M | 18 |
| PPI Ex Food, Energy, Trade MoM | 12/12/2014 | 65 | M | 11 |
This table shows variables included in the price news index $$pni$$. Price series are reported in chronological order. For each series, we report the date the consensus forecast was first available in Bloomberg, the number of observations in our sample, the frequency, and the relevance index. The relevance index is the number of Bloomberg users that set up an automatic alert to be notified when the figure for a given macroeconomic variable has been released.
Source: Bloomberg Finance LP, Bloomberg Terminals (Open, Anywhere, and Disaster Recovery Licenses); and Bloomberg Finance LP, Bloomberg Per Security Data License.
1. Altavilla, Carlo & Giannone, Domenico & Modugno, Michele, 2017. "Low frequency effects of macroeconomic news on government bond yields," Journal of Monetary Economics, Elsevier, vol. 92(C), pages 31-46. Return to text
2. In our sample, we have 137 scheduled FOMC periods from March 17th 2003 to April 28th 2020. The average length of a FOMC period is 33 trading days, with a minimum value of 24 and a maximum value of 42. Note that scheduled FOMC meetings excludes cancelled meetings, so we do not consider the cancelled March 18, 2020 FOMC meeting. Return to text
3. We obtain very similar results, with only marginally weaker explanatory power, if we do not exclude (and thus end each period with) the second day of the FOMC meeting. Return to text
McCoy, Jack, Michele Modugno, Dino Palazzo, and Steve Sharpe (2020). "Macroeconomic news and stock prices over the FOMC cycle," FEDS Notes. Washington: Board of Governors of the Federal Reserve System, October 14, 2020, https://doi.org/10.17016/2380-7172.2745.
Disclaimer: FEDS Notes are articles in which Board staff offer their own views and present analysis on a range of topics in economics and finance. These articles are shorter and less technically oriented than FEDS Working Papers and IFDP papers.