FEDS Notes
August 04, 2020
Principal Trading Firm Activity in Treasury Cash Markets
James Collin Harkrader, Michael Puglia
This FEDS Note is the first in a three-part series on Treasury and Agency MBS market structure. The time period under study in this series ends in 2019 and therefore does not consider the significant events that have occurred in Treasury and Agency MBS markets in 2020. These events will no doubt be a subject of study for many years to come and we intend for this series to inform ongoing and future work on this topic.
This FEDS Note aims to share insights on Treasury cash transactions reported in the Financial Industry Regulatory Authority (FINRA)'s Trade Reporting and Compliance Engine (TRACE).1 Following earlier joint FEDS Notes2 and Liberty Street Economics blog posts3 that examined aggregate trading volume in the Treasury cash market across venues and security types, this post sheds light on the trading activity of Principal Trade Firms (PTFs) and other market participants that are not registered broker-dealer members of FINRA.
On April 1, 2019, a new FINRA rule took effect that requires the electronic interdealer broker (IDB) platforms used by PTFs to identify all of their customers in trade reports. Formerly, non-FINRA customers of the IDB platforms appeared anonymously in trade reports, which prevented the official sector recipients of the TRACE Treasury data from conducting detailed analysis on the trading activities of these participants.4 Using the newly identified data, we can now confirm that, measured on the basis of average daily trading volume, PTFs are the dominant class of participant in the electronic IDB venue of the Treasury cash market, while primary and other dealers remain the dominant class of intermediaries in the Treasury cash market overall. The new data also suggests that PTFs are making inroads into parts of the Treasury cash market outside of their traditional domain (i.e. trading on-the-run nominal securities on the electronic IDB platforms). Finally, we find that "self-trading" in the Treasury cash market, a phenomenon first identified in the Joint Staff Report (JSR), accounts for about 5% of trading activity in the electronic IDB venue over our sample.
Identification of PTFs and Other Non-FINRA Members in TRACE Treasury Reports
The JSR highlighted the official sector's need for data on trading activity in the Treasury cash market in order to better understand the market as it evolves. Following the JSR, the industry took steps to improve the official sector's access to information, which culminated in July 2017 when FINRA members began reporting Treasury cash transactions to TRACE. Trade reporting greatly improved the official sector's ability to monitor activity in the Treasury cash market; however, important gaps in the available data remained. Notably, PTFs, which were a major focus of study in the JSR, were anonymous in the "original" version of the TRACE data, owing to the fact that most do not meet the definition of "dealer" as set in the Securities Exchange Act of 1934.5 As such, PTFs were and still are not required to register with FINRA or report their transactions to TRACE.
In order to address this gap in the data, the SEC approved an amendment to FINRA's TRACE reporting rules for Treasury securities requiring major IDB platforms to identify non-FINRA member subscribers in TRACE Treasury trade reports, effective April 1, 2019.6 In short, while these IDB platforms attributed trades conducted by non-FINRA participants, such as PTFs, to a generic category "Customer" prior to the rule amendment, from April 1, 2019 onward the platforms have been required to identify all firms in their trade reports, even those that are not FINRA members.7
Accurately Identifying PTF Activity in Treasury Cash Markets
A previous FEDS Note, published prior to the reporting rule amendment, reported a high-level breakdown of activity in the IDB venue across participant types.8 That note showed that PTFs account for the majority of trading activity on the electronic IDB platforms, but very little of the activity in the voice/manual screen segment of that venue. The TRACE data used to conduct that analysis did not identify PTFs, however, which precluded a precise measurement of their trading activity. Instead, assumptions derived from the results of the JSR were used to estimate PTF activity. In essence, it was assumed that the PTF share of non-dealer activity studied by the JSR would largely hold in the newer TRACE data.9
Using the newly identified data, we have reconstructed the previous analysis without the simplifying assumptions. Table 1 below restates the results, which largely corroborate the prior note's estimates. Again, we find that, when measured on the basis of trading volume, PTFs dominate activity on the electronic IDB platforms (61%).10
Table 1: Participant Trading Volume Shares on Interdealer Broker Platforms
| Participant | Electronic/Automated | Voice/Manual Screen | Total |
|---|---|---|---|
| Principal Trading Firms | 61% | 12% | 48% |
| Primary Dealers and Other Dealers | 38% | 76% | 48% |
| Buy-side (estimated) | 1% | 13% | 4% |
| Total ($ billion) | 191 | 69 | 259 |
Note: The table reports the trading volume shares of the different participant types for nominal coupon securities on Treasury IDB platforms from April 1, 2019 to December 31, 2019. The bottom row reports average daily volume over the period. Buy-side share is assumed to capture institutions such as hedge funds and investment firms but may also include other financial institutions such as banks. Since some smaller, mainly voice IDB platforms are not subject to FINRA’s reporting rule amendment - but all the major Treasury electronic IDB platforms are subject - some IDB activity in the TRACE data remains unidentified after the TRACE reporting amendment. This is most readily seen in the buy-side (estimated) share for the voice/manual screen segment. Overall, the still unidentified share is a very small fraction of total activity.
Source: Authors' calculations based on Trade Reporting and Compliance Engine (TRACE) data from the Financial Industry Regulatory Authority (FINRA).
Direct Streaming Protocol in Treasury Cash Markets
The updated results in Table 1 highlight a few new developments in Treasury cash market structure that bear mention. First, the new breakdown reveals more activity by PTFs on the voice/manual screen platforms (12%) than previously estimated. This is interesting for two reasons. First, it corroborates anecdotal evidence that some PTFs are attempting to expand their activity beyond just on-the-run nominal coupon securities and into off-the-runs and bills as well.11 Second, it indicates that some IDB platforms formerly characterized as voice/manual screen have electronified and now enable automated market making on their platforms, which makes algorithmic trading and PTF participation possible. Other data (not shown) suggests that average daily volume of trading via direct streaming protocol is also increasing. More generally, IDB platforms on both sides of the electronic/voice divide are beginning to offer similar electronic services,12 which suggests a more general shift towards electronification across the interdealer brokers. This activity was not observable prior to FINRA's rule amendment and there was little in the JSR to otherwise inform the analysis, since direct streaming in Treasury markets was for practical purposes non-existent in October 2014. All of this highlights how the Treasury market has continued to evolve since the publication of the JSR.
Primary and Other Dealer Activity in Treasury Cash Markets
Though PTFs dominate activity on electronic IDB platforms, the new data confirms that primary and other dealers continue to dominate intermediation in the Treasury cash market overall. Figure 1 below shows the breakdown of all activity – across all venues and security types13 – by participant type. Buy-side firms account for 25% of all activity while primary and other dealers account for little over half, leaving only 21% of activity to the remaining participants, which we now positively identify as PTFs.14
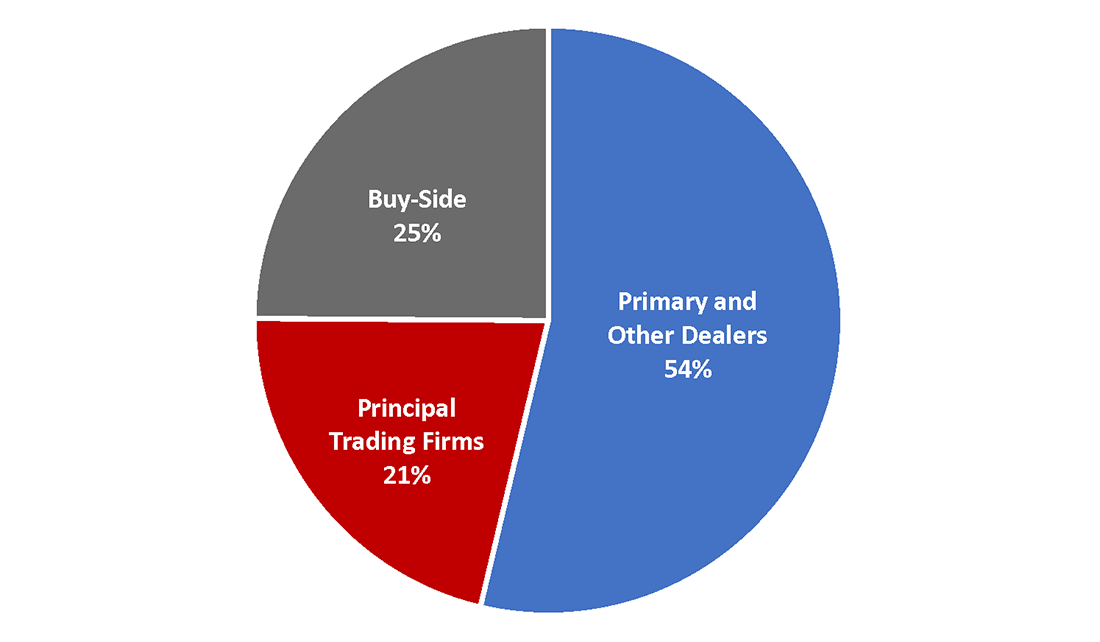
Note: The figure reports shares of trading volume by participant type for the entire cash Treasury market from April 1, 2019 to December 31, 2019
Source: Authors' calculations based on Trade Reporting and Compliance Engine (TRACE) data from the Financial Industry Regulatory Authority (FINRA).
In addition to illuminating the behavior of PTFs in the Treasury cash market, the identified TRACE data also sheds new light on the activity of primary and other dealers. Though the TRACE reporting rule amendment ostensibly targeted PTF activity, it was written to compel the major electronic IDB platforms to identify any non-FINRA customer. In addition to PTFs, this group of non-FINRA member financial intermediaries includes some Federal Reserve member banks15 as well as foreign and other branches of FINRA-member dealer firms. Table 2 shows the breakdown of activity in nominal coupon Treasury securities on IDB platforms conducted by primary and other dealers and their related global and domestic banking companies, across FINRA and non-FINRA member entities. It excludes the activity of PTFs and other participants not associated with a primary or other dealer firm. About $16 billion dollars per day is transacted by financial intermediaries that are not FINRA members but still associated with FINRA-member primary and other dealer firms.
Table 2: Primary and Other Dealer Trading Volumes on Interdealer Broker Platforms
| IDB Average Daily Volume ($ billion) | |||
|---|---|---|---|
| FINRA Member | Non-FINRA Member | Total | |
| Primary Dealers and Related Entities | 95 | 10 | 105 |
| Other Dealers and Related Entities | 13 | 6 | 19 |
| Total | 108 | 16 | 124 |
| Share | 87% | 13% | 100% |
Note: The table reports the trading volume shares of nominal coupon Treasury securities for primary and other dealers and related entities (domestic banks, foreign branches, etc.) in the interdealer broker venue across FINRA member entities and non-FINRA member entities from April 1, 2019 to December 31, 2019.
Source: Authors' calculations based on Trade Reporting and Compliance Engine (TRACE) data from the Financial Industry Regulatory Authority (FINRA).
Concentration of Intermediaries in the Treasury Cash Market
The JSR examines the relative concentrations of Treasury market participants on the BrokerTec platform by type. Now that PTFs and other non-FINRA members are identified in the trade reports of the major IDBs, it is possible to estimate their relative concentrations using the TRACE data as well, and across all venues. Table 3 below displays Herfindahl-Hirschman indices (HHI) for the IDB and DTC venues.16 In the DTC case, only the intermediating dealer firms are included in the calculation (i.e. the volumes attributable to unidentified or buy-side customer firms are omitted). Values for the electronic/automated IDB venue (second row, in italics) are roughly comparable to values reported in the JSR, which have been included in parentheses.17 While the HHI for all firms in the TRACE data is higher than the JSR (0.082 vs 0.07), for the top 10 PTFs and top 10 dealers the values are very close, suggesting that smaller PTFs and dealers outside the top 10 are less active than they were in October 2014. Furthermore, note that the top 10 PTFs account for 43% of volume in the IDB venue, while the top 10 dealers account for 74% of volume in the DTC venue.
We may take this latter finding as evidence that activity in the IDB venue of the cash Treasury market would be concentrated amongst relatively few dealers if not for PTF participation. Indeed, prior to the entrance of PTFs to the market in the early 2000's,18 primary and other dealers would have accounted for nearly all intermediation, by definition.19 In matters concerning regulation and oversight of the Treasury market, this serves to underscore that any policy that has the effect of reducing the intermediation conducted by one class of participant will necessarily increase the market concentration of all others if trading volumes remain the same.
Table 3: Primary and Other Dealer Trading Volumes on Interdealer Broker Platforms
| All Firms | Top 10 PTFs | Top 10 Dealers | |
|---|---|---|---|
| IDB Venue | |||
| Total Venue HHI | 0.056 | 0.227 | 0.11 |
| Electronic/Automated IDB Sub-Venue HHI | 0.082 (0.07) | 0.231 (0.23) | 0.114 (0.11) |
| Voice/Manual Screen IDB Sub-Venue HHI | 0.043 | 0.29 | 0.115 |
| Share of Total Venue Volume | 100% | 43% | 32% |
| DTC Venue | |||
| Total Venue HHI | 0.066 | N/A | 0.114 |
| Share of Total Venue Volume | 100% | N/A | 74% |
Note: The table reports the Herfindahl-Hirschman indices and volume shares for the IDB and DTC venues of the cash Treasury market for nominal coupon securities from April 1, 2019 to December 31, 2019.
Source: Authors' calculations, based on Trade Reporting and Compliance Engine (TRACE) data from the Financial Industry Regulatory Authority (FINRA).
"Self-Trading" in the Treasury Cash Market
The reporting rule changes and the identification of PTF activity on the IDB platforms has also made it possible to identify "self-trading" in the TRACE data. First described in the JSR, self-trading is defined as "a transaction in which the same entity takes both sides of the trade so that no change in beneficial ownership results."20 Self-trading can occur when a single firm running multiple, independent automated trade algorithms on an anonymous central limit order book (CLOB) platform21 has one algorithm's bid matched against another algorithm's offer.22 For the period between April and December 2019, we find that self-trading accounts for 5.4% of ADV in the electronic/automated IDB venue, or about $10.2 billion per day, and that PTFs account for nearly all of that activity. This estimate is approximately equal to the estimate of 5.6% reported in the JSR for all firms on control days.23
Conclusion
The identification of PTFs and other non-FINRA member customers of the major Treasury IDB platforms in the TRACE Treasury dataset since April 2019 has provided the official sector a more detailed view of activity in the Treasury cash market. Largely, this new data confirms estimates published previously in the JSR and several FEDS Notes and Liberty Street Economics blogs. In short, PTFs dominate activity on the electronic IDB platforms, while primary and other dealers continue to dominate intermediation in the Treasury cash market more broadly, particularly in the DTC venue. That said, since the publication of the JSR, PTFs have slowly expanded their activity into new parts of the market, and this was made possible in part by the advent of direct streaming. At the same time, FINRA's TRACE reporting rule amendment has also revealed the extent to which domestic banks and foreign branch firms associated with primary and other dealers transact on electronic IDB platforms. Finally, self-trading continues to be observed on electronic IDB platforms in similar proportions as it occurred on and near October 15, 2014, as detailed in the JSR, and can still be attributed mainly to PTF participants.
1. This analysis was conducted within the context of broader work on the Treasury TRACE data by partner agencies in the Interagency Working Group on Treasury Market Surveillance (IAWG). Recent work by the IAWG that is related to this particular note includes insights presented on December 3, 2018 at the "Evolving Structure of the U.S. Treasury Market: Fourth Annual Conference" and an announcement on the weekly release of aggregated data on September 23, 2019 at the "2019 U.S. Treasury Market Conference." The IAWG's aims are to enhance official-sector monitoring of the Treasury securities market and improve understanding and transparency of this market more generally, while not impeding market functioning and liquidity. Return to text
2. See: Unlocking the Treasury Market through TRACE and Breaking Down TRACE Volumes Further Return to text
3. See: Unlocking the Treasury Market through TRACE and Breaking Down TRACE Volumes Further Return to text
4. Several estimates of their activity were published in the notes cited above. Return to text
5. See U.S. Treasury Department, Capital Markets Report, p. 79. Return to text
6. More technically, the FINRA rule amendment requires all registered alternative trading systems (ATS) to identify their customers in TRACE Treasury reports, subject to a minimum volume threshold. Since all of the major Treasury electronic IDB platforms are registered ATSs, the distinction between IDB's and ATS's is not material to this analysis. Return to text
7. Prior to April 1, 2019, this rendered it impossible to distinguish PTF activity separately from the activity of banks and other buy-side institutions in the IDB venue. Note that, generally, buy-side institutions do not participate in the IDB venue, and so they remain anonymous in the TRACE data in the "Customer" category, even after the amendment. Return to text
8. See Table 1: Participant Trading Volume Shares on Interdealer Brokers in Unlocking the Treasury Market through TRACE. Return to text
9. The JSR used BrokerTec data only, while the TRACE data is more comprehensive and includes all Treasury IDBs, both electronic and voice/manual screen. Return to text
10. These results are further corroborated by data presented by the U.S. Treasury Dept. at the "2019 U.S. Treasury Market Conference", which showed that the weekly trading volume of PTFs on electronic IDB platforms averaged about 60% of total volume. Return to text
11. Securities such as off-the-runs and spreads are not traded on electronic/automated platforms. These platforms generally only trade the six nominal on-the-run coupon CUSIPs on any given date. Bills and off-the-run coupon securities are traded on voice/manual screen platforms in volumes that dominate on-the-run securities. Return to text
12. See Buy-side pursues executable streams for US Treasuries trading, The Hidden Treasure in Treasury Trading and Treasury Trading Q&A Return to text
13. To be clear, Table 1 display volumes only for nominal coupon securities in the IDB venue. Return to text
14. Note that the ~60% market share reported here in Table 1 and by Treasury in Slide 8 of its presentation at the "2019 U.S. Treasury Market Conference" pertain only to nominal coupon securities traded in the electronic IDB sub-venue of the Treasury cash market. The lower 21% share reported here in Figure 1 encompasses all Treasury securities including bills, TIPS and FRNs and all venues of the market, including the DTC and DTD venues. Return to text
15. Banks that conduct Treasury trading activity under the Government Securities Act of 1986 are not dealers or FINRA members. In 2016 the Federal Reserve Board announced its intention to collect Treasury transaction data from banks. This intention was reiterated in a speech in December 2018. Return to text
16. The HHI is a measure of the size of firms in relation to the size of the overall venue, and is calculated as the sum of the squared market share for each firm and takes a value between 1/n and one, where n is the number of firms in the market. A large HHI indicates a high concentration of activity amongst few firms while a low HHI indicates broad parity between all firms in the market. Return to text
17. See JSR, tables 3.7 and 3.8. Return to text
18. See Mizrach, Bruce and Christopher Neely, "The Transition to Electronic Communications Networks in the Secondary Treasury Market," Federal Reserve Bank of St. Louis Review 88, Nov/Dec 2006, for more detail on the early development of electronic IDBs in U.S. fixed income markets. Return to text
19. In the second FEDS note of this series, this issue is further explored using the agency mortgage-backed security (MBS) market as a counterfactual. Return to text
20. See JSR, p. 32 for a full description and example. Return to text
21. This would include all of the major Treasury IDB platforms like BrokerTec, NASDAQ Fixed Income, TPICAP, BGC Fenics, etc. Return to text
22. It is important to note that "self-trade" and "wash-trade" are not synonymous, since the former is generally considered to occur inadvertently and without fraudulent indent. For more information on self-trading, see FINRA's rule regarding self-trading or the Futures Industry Association (FIA) Principal Traders Group (PTG) response to CFTC's Concept Release on Risk Controls and System Safeguards for Automated Trading Environments. Return to text
23. See JSR, table 3.9. Return to text
Harkrader, James Collin, and Michael Puglia (2020). "Principal Trading Firm Activity in Treasury Cash Markets," FEDS Notes. Washington: Board of Governors of the Federal Reserve System, August 04, 2020, https://doi.org/10.17016/2380-7172.2620.
Disclaimer: FEDS Notes are articles in which Board staff offer their own views and present analysis on a range of topics in economics and finance. These articles are shorter and less technically oriented than FEDS Working Papers and IFDP papers.