FEDS Notes
March 06, 2020
The Great Recession and a Missing Generation of Exporters
William F. Lincoln, Andrew H. McCallum, and Michael Siemer
Introduction
While the large collapse in aggregate international trade volumes during the Great Recession has been widely studied in the literature, the recovery is much less well understood. Indeed, by 2014 U.S. foreign sales were still below their historical post-recession level. In this note, we summarize the results of Lincoln, McCallum, and Siemer (2019), which considers how much of a role a "missing generation of exporters" played in explaining the relatively slow growth of foreign sales after the financial crisis.1 Using confidential data from the U.S. Census covering firms in all sectors with as few as one employee and all export shipments of goods recorded by U.S. Customs and Border Protection, we first find evidence of a substantial increase in the number of exits from and a decline of entries into international markets during the crisis years. We then consider how this affected aggregate global trade. Using an export growth decomposition, we examine the effects that the changes in the number of exporting firms had on the trajectory of total foreign sales from 2008 to 2014. While the extensive margin of firm foreign market participation showed large changes, this was offset by the relatively larger volume of foreign sales from new entrants into international markets. The slow growth in exports since the Great Recession is thus largely accounted for by the behavior of incumbent exporters.
Stylized Facts
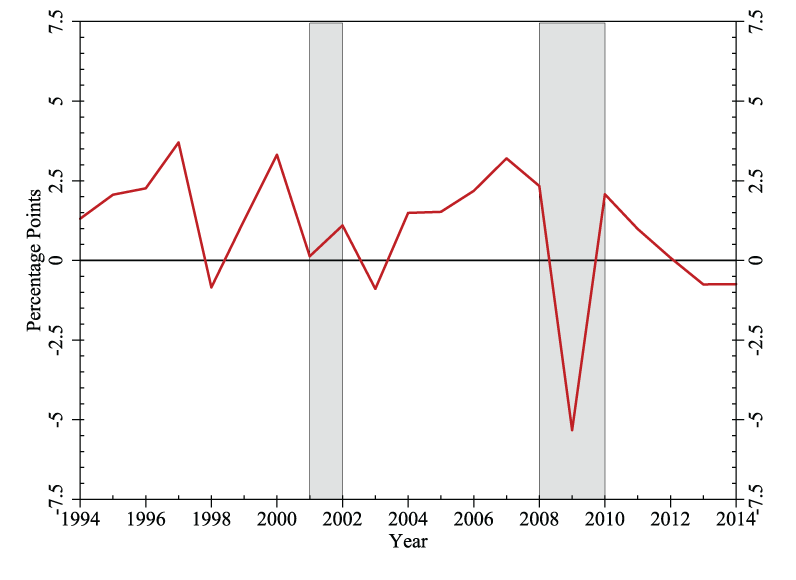
Figure 1a plots firm entry and exit rates in foreign markets from 1993 to 2014. The entry rate is defined as the number of firms that begin selling in foreign markets from year t-1 to year t, divided by the count of businesses that sold abroad in year t. The exit rate is defined similarly. Consistent with the results in Lincoln and McCallum (2018) for the manufacturing sector, the entry rate typically exceeds the exit rate, which helps explain the rise of exporting by U.S. firms over time. During the Great Recession, however, the entry rate dropped sharply and the exit rate rose significantly. The difference between the entry and exit rates shown in Figure 1b declined by more than 5 percentage points during the 2008-2010 period. Given that the vast majority of U.S. exports come from innovative firms (Lin and Lincoln, 2017) and that foreign countries are often dependent on imports from America to gain access to the latest technologies (Eaton and Kortum, 2001), these changes likely had large welfare effects internationally.
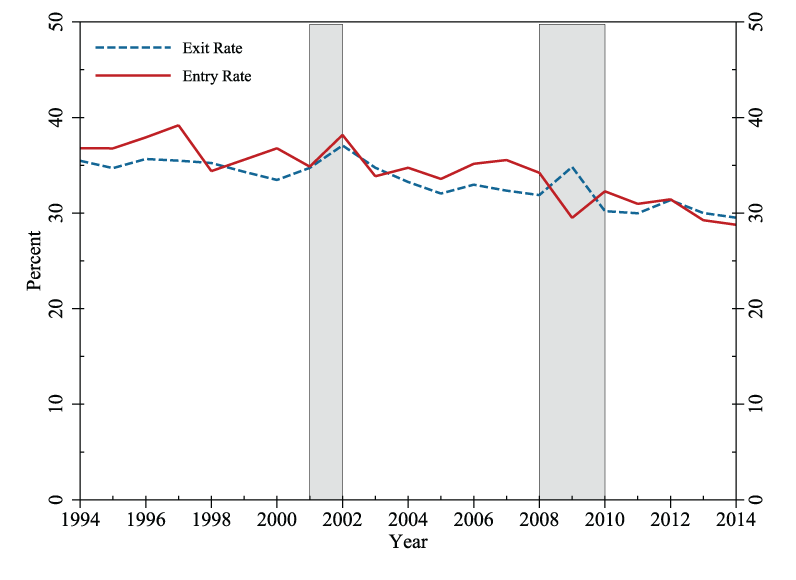
Notes: The graph considers export entry and exit rates from 1994 to 2014. Recessions are indicated by shaded bars.
Notes: The graph considers export entry and exit rates from 1994 to 2014. Recessions are indicated by shaded bars.
Export Growth Decomposition
Whether these extensive margin shifts had substantial impacts on aggregate U.S. exports, however, is a different question. To determine the effects of this sudden increase in exits and decrease in entries, we decompose the log growth of total exports over h years $$g_t^h$$ into five margins as
$$$$ \begin{eqnarray} g_{t}^{h} &=& \underbrace{\ln\left(\dfrac{\bar{X}_{t}\left(I_{t\cap t-h}\right)}{\bar{X}_{t-h}\left(I_{t\cap t-h}\right)}\right)}_{i_{t}^{h}=\; \text{intensive margin }} \cr &+& \underbrace{ \underbrace{\ln\left(\dfrac{N_{t}\left(I_{t}\right)}{N_{t}\left(I_{t\cap t-h}\right)}\right)}_{ee_{t}^{h}=\; \text{entry extensive }} + \underbrace{\ln\left(\dfrac{\bar{X}_{t}\left(I_{t}\right)}{\bar{X}_{t}\left(I_{t\cap t-h}\right)}\right)}_{ei_{t}^{h}=\; \text{entry intensive}} }_{ e_{t}^{h}=\; \text{entry margin } } \cr &-& \underbrace{ \underbrace{\ln\left(\dfrac{N_{t-h}\left(I_{t-h}\right)}{N_{t-h}\left(I_{t\cap t-h}\right)}\right) }_{ xe_{t}^{h}=\; \text{exit extensive } } - \underbrace{\ln\left(\dfrac{\bar{X}_{t-h}\left(I_{t-h}\right)}{\bar{X}_{t-h}\left(I_{t \cap t-h}\right)}\right) }_{ xi_{t}^{h}=\; \text{exit intensive } } }_{ x_{t}^{h}=\; \text{exit margin} } \end{eqnarray} \ \ \ \ \ (1) $$$$
The derivation of this expression uses the fact that the foreign sales of any group of firms can be written as the average exports of each firm times the number of firms that sell abroad. The appendix of Lincoln et al. (2019) contains the full mathematical details of the decomposition. In year t, $$I_{t}$$ denotes the set of businesses that sell abroad, $${\overline{X}}_{t}(I_{t})$$ denotes average foreign sales per exporting firm, and $$N_{t}(I_{t})$$ denotes the number of exporters. $$I_{t \cap t - h}$$ refers to the set of firms that serve foreign markets in years t - h and t, $${\overline{X}}_{t}(I_{t \cap t - h})$$ refers to the mean level of exports per incumbent exporting firm in year t, and $$N(I_{t \cap t - h})$$ refers to the number of firms that export in both years.
Considering the different margins of export growth, $$i_{t}^{h}$$ gives the intensive margin contribution by firms that sold abroad in years t - h and t. The next four terms constitute the net extensive margin $$n_{t}^{h}$$, which is defined as the difference between the entry margin $$e_{t}^{h}$$ and exit margin $$x_{t}^{h}$$. The first of these terms is the contribution of firms that did not export in year t - h but did so in year t. The second is similarly the contribution of those that sold abroad in year t - h but did not do so in year t. We further separate out both $$e_{t}^{h}$$ and $$x_{t}^{h}$$ into extensive and intensive margin terms. For example, $$e_{t}^{h}$$ can be expressed as a combination of $$ee_{t}^{h}$$ and $$ei_{t}^{h}$$. The first of these is given by the number of firms entering foreign markets relative to the count of firms already selling there. The second captures the average foreign sales of those entrants.
Table 1: Annualized Real Export Log Growth Decomposition, 1993-2006 vs. 2008-2014
Panel A: 1993-2006 Average
| h = 1 | h = 2 | h = 3 | h = 4 | h = 5 | h = 6 | |
|---|---|---|---|---|---|---|
| Total growth | 6.08 | 5.67 | 5.34 | 5.1 | 4.78 | 4.67 |
| Intensive | 6.82 | 6.54 | 6.24 | 5.96 | 5.66 | 5.6 |
| Net extensive | -0.74 | -0.87 | -0.9 | -0.86 | -0.88 | -0.93 |
| Entry margin | 2.91 | 2.71 | 2.63 | 2.58 | 2.54 | 2.49 |
| Extensive | 44.64 | 29.48 | 23.64 | 20.41 | 18.29 | 16.79 |
| Intensive | -41.73 | -26.77 | -21.01 | -17.83 | -15.75 | -14.3 |
| Exit margin | -3.65 | -3.58 | -3.53 | -3.44 | -3.42 | -3.42 |
| Extensive | -42.41 | -27.26 | -21.5 | -18.34 | -16.28 | -14.75 |
| Intensive | 38.76 | 23.68 | 17.97 | 14.9 | 12.86 | 11.33 |
Panel B: 2008-2014
| h = 1 | h = 2 | h = 3 | h = 4 | h = 5 | h = 6 | |
|---|---|---|---|---|---|---|
| Total growth | -15.65 | -1.06 | 1.47 | 2.21 | 2.24 | 2.35 |
| Intensive | -15.11 | -0.41 | 2.09 | 3.05 | 2.89 | 3 |
| Net extensive | -0.53 | -0.65 | -0.62 | -0.84 | -0.64 | -0.65 |
| Entry margin | 2.17 | 2.18 | 2.25 | 2.12 | 2.1 | 1.9 |
| Extensive | 34.96 | 23.11 | 18.14 | 15.76 | 13.65 | 12.26 |
| Intensive | -32.79 | -20.93 | -15.89 | -13.65 | -11.55 | -10.36 |
| Exit margin | -2.7 | -2.83 | -2.88 | -2.96 | -2.74 | -2.55 |
| Extensive | -42.82 | -25.53 | -19.28 | -16.58 | -12.1 | -13.16 |
| Intensive | 40.12 | 22.7 | 16.4 | 13.63 | 11.78 | 10.61 |
Notes: The table decomposes the growth in aggregate real exports over 1993-2006 and 2008-2014 using equation (1). The different columns correspond to the different time horizons over which the figures are calculated. We divide each figure across the columns by the time horizon h for ease of comparison.
Panel A of Table 1 shows estimates of each of the five terms in equation (1) for all firms that exported at least once between 1993 and 2006. The estimates are shown for each horizon h between one year and six years and are annualized for the purposes of comparison. This creates a historical reference point that we can use to study the behavior of exports during and after the Great Recession. As shown in column h=1 in Panel A, one year log growth averaged 6.1 log percent per year between 1993 and 2006. The intensive margin on average contributes 6.8 log percentage points (lppt.), while the net extensive margin takes away a relatively small 0.7 lppt. Despite this minor negative net contribution, there is significant gross churn in the entry and exit margins, which on average contribute 2.9 and negative 3.7 lppt. respectively. Both entering and exiting firms also tend to be smaller in terms of foreign sales than the average incumbent exporter.
Panel B of Table 1 documents the same figures as in Panel A but begins in 2008, as 2009 is the the first year that we observe a decline in total foreign sales. Comparing the results in column h=6 in Panel A with the same figure in Panel B shows that average export growth over 2008-2014 was only 2.4 lppt., whereas it was 4.7 lppt. in the pre-crisis years. While the contribution of the intensive margin was 3 lppt. relative to the pre-crisis average of 5.6 lppt., other margins also differed.
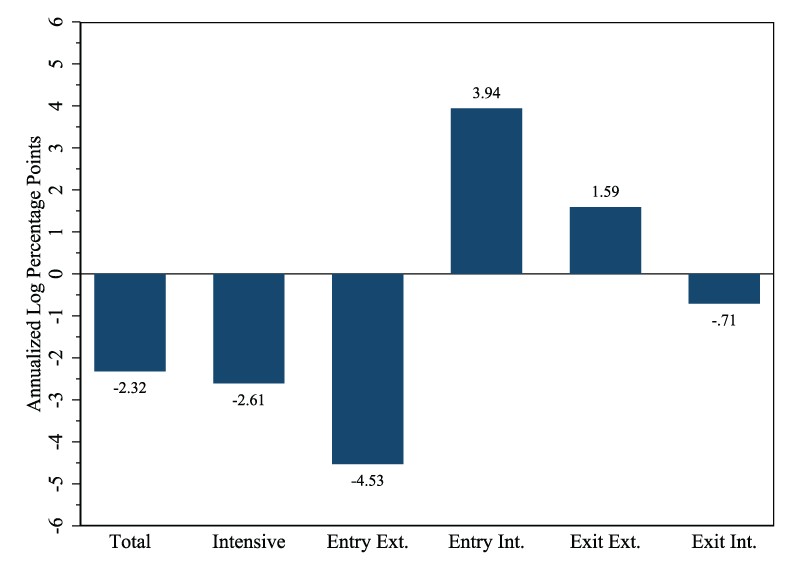
Notes: The figure depicts the contributions of the different margins of exports over 2008-2014 relative to those over 1993-2006. Mechanically, these are calculated using the differences between the values in column h = 6 in Panel A of Table 1 and the same numbers in Panel B.
Figure 2 demonstrates the differences across each of the terms in equation (1) at the h=6 horizon. The estimates here are simply given by the difference between the numbers in Panel B and Panel A of Table 1. The entry extensive margin illustrates the largest difference, decreasing export growth by 4.5 lppt. more than it did on average between 1993-2006. This large reduction was alleviated by an increase in the size of the typical new exporter, which added 3.9 lppt. and left the total entry margin effect at only negative 0.6 lppt. Similar behavior exists for the exit extensive and exit intensive margins, so that the exit margin's total effect is to add 0.9 lppt. more to total export growth than the average historical contribution. Concurrently analyzing the entry and exit margins shows that the net extensive margin added 0.3 lppt. more to aggregate real export growth after the Great Recession than during 1993-2006.
Conclusion
This note summarizes the findings of Lincoln et al. (2019) and documents evidence of substantial firm exits and a decline in firm entries in global markets during the Great Recession. Decomposing the log growth of total exports, we show that the decline in entries and surge in exits were countered by the relatively larger level of foreign sales of entrants into international markets during these years. Thus, while a missing generation of exporters affected the variety of goods sold internationally by the United States, the effect of these trends on aggregate export volumes was small.
References
Barresse, Glenn, Fariha Kamal, Javier Miranda, and Wei Ouyang, 2016, "Business Dynamics of U.S. Exporters: Integrating Trade Transactions Data with Business Administrative Data," Technical report (Washington, D.C.: U.S. Census Bureau).
Bernard, Andrew, J. Bradford Jensen, Stephen Redding, and Peter Schott, 2009, "The Margins of US Trade," American Economic Review, Vol. 99, No. 2, pp. 487--493.
Eaton, Jonathan and Samuel Kortum, 2001, "Trade in Capital Goods," European Economic Review, Vol. 45, No. 7, pp. 1195--1235.
Lin, Jenny and William Lincoln, 2017, "Pirate's Treasure," Journal of International Economics, Vol. 109, No. 1, pp. 235--245.
Lincoln, William and Andrew McCallum, 2018, "The Rise of Exporting by U.S. Firms," European Economic Review, Vol. 102, No. 1, pp. 280--297.
Lincoln, William F., Andrew H. McCallum, and Michael Siemer, 2019, "The Great Recession and a Missing Generation of Exporters," IMF Economic Review, Vol. 68, No. 4.
1. More details regarding these data and our results are found in Lincoln et al. (2019). Any opinions and conclusions expressed herein are those of the authors and do not necessarily represent the views of the U.S. Census Bureau. All results have been reviewed to ensure that no confidential information is disclosed. Support for this research through the University of Michigan Research Data Center from NSF(ITR-0427889) is also gratefully acknowledged. Bernard et al. (2009) were the first to build the Longitudinal Firm Trade Transactions Database (LFTTD) and recent improvements were made by Barresse et al. (2016). Return to text
Lincoln, William F., Andrew H. McCallum, and Michael Siemer (2020). "The Great Recession and a Missing Generation of Exporters," FEDS Notes. Washington: Board of Governors of the Federal Reserve System, March 6, 2020, https://doi.org/10.17016/2380-7172.2531.
Disclaimer: FEDS Notes are articles in which Board staff offer their own views and present analysis on a range of topics in economics and finance. These articles are shorter and less technically oriented than FEDS Working Papers and IFDP papers.