FEDS Notes
September 28, 2020
Wealth and Income Concentration in the SCF: 1989–2019
Jesse Bricker, Sarena Goodman, Kevin B. Moore, and Alice Henriques Volz with assistance from Dalton Ruh
This note was revised on September 30, 2020 to correct the second column of Panel B of Table B, which erroneously reported the mean of inheritance assets that were received or expected. The corrected table reports the mean of expected inheritance assets only.
Understanding how economic growth diffuses across the population is a key economic issue. Indeed, this question has inspired renewed debate about how to characterize wealth and income distributions in the United States, particularly with respect to the extent of concentration at the top. Most of this work has described an increase in recent decades in concentration, raising concerns that broader segments of the population are not sharing in economic gains (Bricker, Henriques, Krimmel, and Sabelhaus, 2016; Saez and Zucman, 2016; Piketty, Saez, and Zucman 2018; though see Auten and Splinter, 2020, for contrast).
This note augments information from the recently released 2019 Survey of Consumer Finances (SCF) to provide updated estimates of the wealth and income distributions. The SCF is a triennial survey that provides the most comprehensive look at the assets, liabilities, income, and demographic characteristics of U.S. families. By combining a wealthy oversample with a nationally representative sample, the SCF is uniquely positioned to measure the entire wealth and income distributions.1 These 2019 SCF data offer the first look at the evolution of wealth concentration since 2016—the most recent year the prior SCF and other distributional estimates (Saez and Zucman, 2019; Smith, Zidar, and Zwick, 2020) describe—capturing the tail end of the longest economic expansion on record. Note that these data do not reflect the effects of the COVID-19 pandemic on family finances, as almost all of the data in the 2019 survey were collected prior to the onset of the pandemic.2
The 2019 SCF indicates that, except for a small shift in concentration from the top 1 percent to the remainder of the top decile, wealth concentration in 2019 was similar to the level seen in 2016 and was near the historical high over the 1989–2019 period.3 We show that historical estimates of the wealth distribution using the SCF and those relying on other data sources were in agreement until the financial crisis — indicating that from 1989 until the crisis, wealth became steadily more concentrated at the top, largely at the expense of the families in the upper-middle segment of the distribution — but since then, the extent of concentration described by the available measures has varied widely. We also leverage the detailed SCF data to characterize how both demographics and sources of wealth—including inheritances—differ across the distribution.
Though our primary focus in this note is on wealth, we also provide estimates of recent trends in the concentration of income—a key flow input into a family's stock of wealth that other methods of characterizing wealth concentration rely on to formulate their estimates—and of the joint distribution between income and wealth. Income concentration at the top declined over 2016–19 but, similar to the concentration of wealth, remained high. Finally, though there is a strong positive correlation between these two important measures of economic well-being, the highest wealth families are often not among the highest income families.
Wealth distribution
Wealth concepts
The standard SCF measure of wealth that, for example, characterized the economic well-being of families in 2019 in the recently released Federal Reserve Bulletin (Bhutta, et al., 2020) —referred to as "Bulletin" hereafter— is based on "marketable" wealth, which is the difference between the market value of assets owned by a family and the amount owed in debts and is a concept that is salient to families and includes assets with values that can be easily looked up. To be able to examine the full distribution of wealth, this note augments the information found in the Bulletin in two ways. First, we expand the wealth concept to include household claims on defined benefit (DB) pension assets. Wealth as measured here, then, includes all assets over which a family has legal claim that can be used to finance its present and future consumption. Second, we include an estimate of the wealth of Forbes 400 families, who are excluded from the SCF sample.
A. Allocating DB wealth
As is, the Bulletin wealth concept leads to uneven treatment of household retirement assets, as it includes assets held in defined contribution (DC) accounts but does not include household claims on DB pension assets. DB pension plans are similar to DC plans in that both provide future income for covered families.4 But unlike DC plans, DB plans cannot be sold and have no market value. Still, more than one-quarter of families aged 35 to 64 participate in DB plans, and DB plans represent the only retirement account for about 9 percent of families in this age range.
Aggregate DB pension assets are collected in the Financial Accounts of the United States, and we use a method described in Sabelhaus and Volz (2019) to allocate this amount across SCF families. Using the SCF's detailed data on DB coverage (on a current or past job), this method allocates DB pension assets as a function of a family's current plan payouts, wages, ages, and expected future payouts (among other factors).5
Prior to allocating the DB pension assets, median family wealth in the SCF Bulletin is a bit more than $121,000 (table A). But DB pensions are a major component of household wealth, representing about 15 percent of the household balance sheet in the Financial Accounts. After allocating these DB reserves across families, median wealth increases to nearly $172,000.6
Table A: Comparison of SCF Bulletin wealth and augmented wealth, 2019 SCF
| Median (thousands of dollars) | Mean (thousands of dollars) | Aggregate (trillions of dollars) | |||
|---|---|---|---|---|---|
| Wealth | Wealth (augmented) | Wealth | Wealth (augmented) | Wealth | Wealth (augmented) |
| 121.7 | 171.8 | 748.8 | 897.2 | 96.3 | 115.4 |
Source: Federal Reserve Board, 2019 Survey of Consumer Finances.
Note: Wealth uses “Bulletin” concept—also called “net worth”—and augmented wealth includes DB pension wealth, distributed across 2019 SCF families.
Allocating DB pension assets increases wealth across the distribution. Figure A below shows the average balance sheet composition of four wealth groups that we will use throughout this note: families ranked in the Bottom 50 percent of the wealth distribution, those in the "Next 40" percent (the 50th to 90th percentiles), those in the "Next 9" percent (90th to 99th percentiles), and the wealthiest "Top 1" percent. Each group's balance sheet is shown on a different y-axis because mean wealth differs so much across groups.
Wealth held in retirement plans is denoted in black, with DB pension wealth represented in the hashed black portion. While DB pension wealth increases average wealth in each group relative to the Bulletin wealth concept, wealth increases the most for families in the next 40 and next 9 groups.
Thousands of 2019 dollars
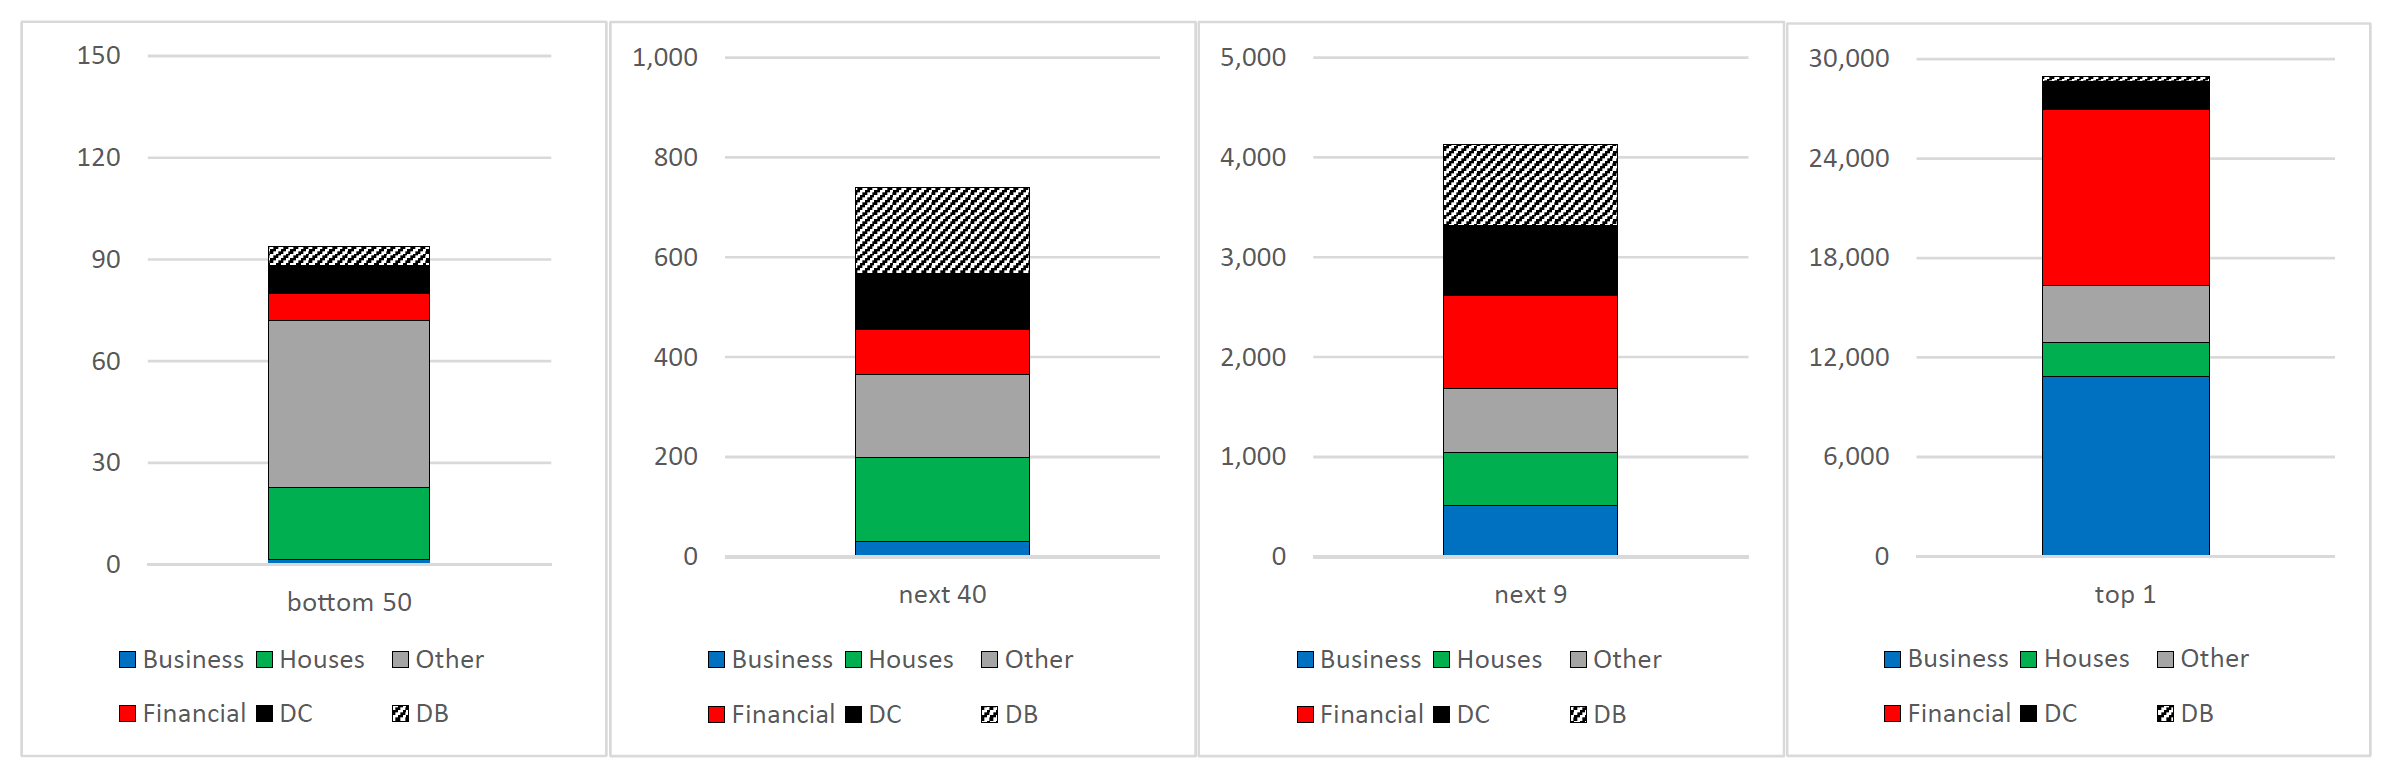
Source: Federal Reserve Board, 2019 Survey of Consumer Finances.
Notes: Figure shows mean asset composition of Bottom 50 wealth percentiles, 50th–90th percentiles (Next 40), 90th to 99th wealth percentiles (Next 9) and wealthiest 1 percent (Top 1), 1989–2019. Business includes privately held businesses, houses is home equity in primary residence, financial includes non-retirement financial assets, DC are retirement assets held in accounts, DB are allocated DB wealth, and other are all other assets.
B. Wealth coverage
The SCF does not sample the Forbes 400 families, as disclosure concerns would negate the possibility of releasing any of their information as part of the public-use microdata. However, we use a method described in Bricker, Hansen, and Volz (2019) to add the wealth of these families to the SCF wealth concentration estimates and complete the upper-tail population coverage in the SCF. In doing so, we add nearly $3 trillion in wealth in 2019.7
Bulletin versus augmented Bulletin wealth
Figure B describes the distribution of wealth across the four wealth groups. The dashed lines denote the Bulletin wealth concept and the solid lines denote the preferred "augmented" wealth concept. Augmented wealth is defined as the Bulletin wealth concept plus allocated DB assets and includes Forbes 400 family wealth.
As is clear from figure B, the wealth distribution is less concentrated at the top when using the augmented wealth concept, reflecting the fact that a significant portion of DB pension wealth is held outside of the wealthiest 1 percent. For example, in 2019, the share of wealth held by the wealthiest 1 percent was 38 percent under the Bulletin concept and 33 percent under the augmented concept, with the 5 percentage point difference going entirely to the "Next 40" group, which moved from 22 percent to 27 percent under the two concepts.8 This general pattern holds for all SCF years, as families in the Next 40 group have accrued more DB pension benefits relative to other assets.
The share of wealth held by the bottom 50 percent is about the same under each wealth concept, and is about 2 percent in 2019 (figure B). The share of wealth held by the 90th to 99th percentiles ("Next 9" group) is also little changed, as they hold DB wealth in proportion to their marketable wealth.
Figure B. Wealth distributions, Bulletin (dashed line) versus Augmented (solid line) Measures, 1989-2019
Share of aggregate wealth
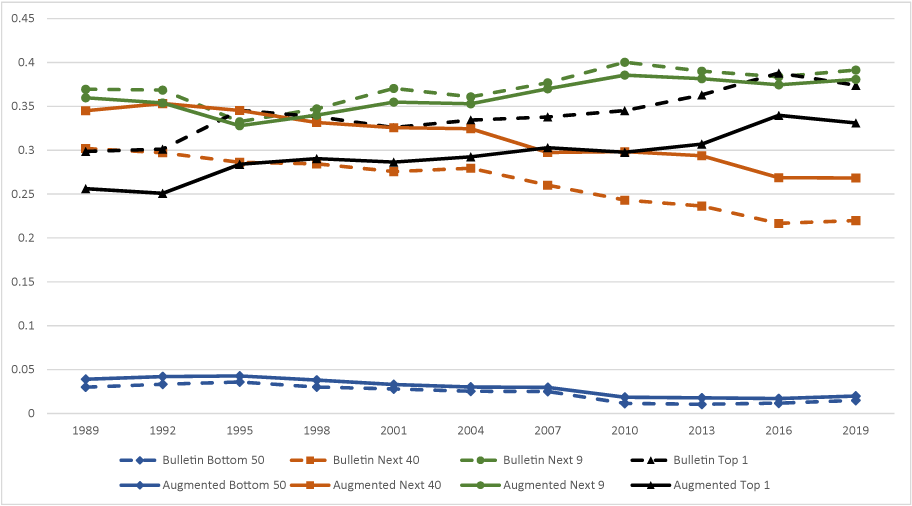
Source: Federal Reserve Board, Survey of Consumer Finances.
Notes: Figure shows share of wealth held by Bottom 50 wealth percentiles and 50th–90th percentiles (Next 40), 90th to 99th wealth percentiles (Next 9) and wealthiest 1 percent (Top 1), 1989–2019.
Changes in wealth distribution, 1989–2019
In both wealth measures, the share of wealth held by each of the four wealth groups shifted only a bit between 2016 and 2019. The long- and short-term trends in the wealth distribution are also similar in both measures (figure B), and we will focus here on just the augmented measure.
The share of wealth held by the top 1 percent fell slightly between 2016 and 2019, from 33.9 to 33.1 percent. Most of this loss was absorbed by the Next 9 wealth group, though, such that the top 10 percent of families (the sum of those two groups) held the same share of wealth in 2019—71 percent—as they did in 2016. Both the Next 40 and Bottom 50 groups also held about the same share of U.S household wealth in 2019 as they did in 2016—27 percent and 2 percent, respectively.
Looking over the longer 1989–2019 period, the wealthiest 1 percent of U.S families have held an increasing share of U.S. wealth. From 1989 to 2007, the share of wealth held by the wealthiest 1 percent of U.S. families increased from 25 percent to 30 percent, remained around 30 percent through 2013, sharply increased to about 34 percent in 2016 and remained near that level in 2019. Families in the Next 9 wealth group have also seen a general increase over time, from 37 percent in 1989 to 39 percent in 2019.
Correspondingly, families outside of the top 10 have seen a steady decline in their share of wealth. Families in the Next 40 (50th–90th percentiles) declined from 35 percent in 1989 to 32 percent in 2001—due to debt growing faster for this group than for those in the top 10—and then to 27 percent in 2019, as assets grew slower than for those in the top 10. Families in the Bottom 50 group have always held less than 5 percent of total wealth, and the share has been close to 2 percent since 2010. These families tend to be younger, with less time to have accumulated assets and with relatively high levels of debts.
Comparison to other wealth distribution estimates
In addition to the SCF data offering the first look at the evolution of wealth concentration since 2016, we can also provide more context for these new estimates by comparing past distributional estimates from the SCF to those from other sources. Other recent estimates are based on "capitalization models," a method that infers a wealth distribution from income. Typically, these models distribute aggregate household assets—often from the Financial Accounts of the United States—using administrative income tax data and a modeled rate of return on household assets.9 Even though the SCF wealth aggregates generally align with the Financial Accounts (Batty et al 2019), methodological differences in wealth measurement in the SCF and in producing the capitalized estimates—and also methodological differences across capitalized estimates—can lead to an unsettled picture of the extent of recent increases in wealth concentration (Bricker and Volz, 2020; Smith, Zidar and Zwick, 2020). Specifically, although the estimated shares of wealth held across the distribution are generally similar using the SCF or these other methods until the Financial Crisis, notable differences remain at the top since then.
Distributional estimates produced by the World Inequality Database (WID) are based on a capitalization model from Saez and Zucman (2016), and the most recent update includes wealth estimates through 2016.10 Broadly speaking, the SCF and WID wealth distribution estimates are nearly identical in the 1989–2016 period for the Bottom 90 (figure C). Both show a declining trend in the Next 40 (from 32 percent in 1989 to 28 percent in 2019) and Bottom 50 (below 5 percent in both) wealth shares (figure C).
Share of aggregate wealth
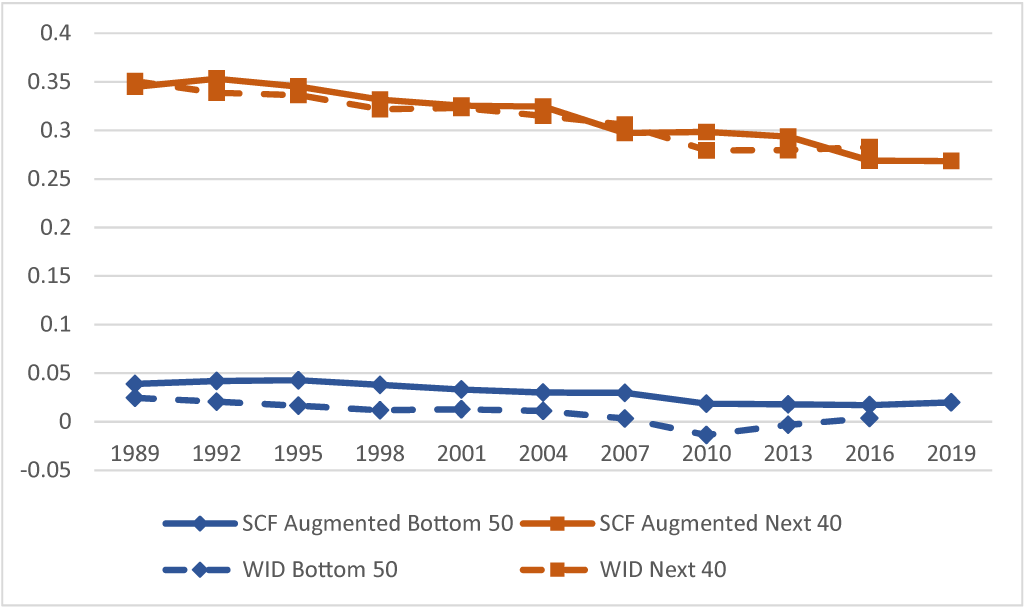
Source: Federal Reserve Board, Survey of Consumer Finances, and WID.
Notes: Figure shows share of wealth held by Bottom 50 wealth percentiles and 50th–90th percentiles (Next 40), 1989–2019.
Share of aggregate wealth
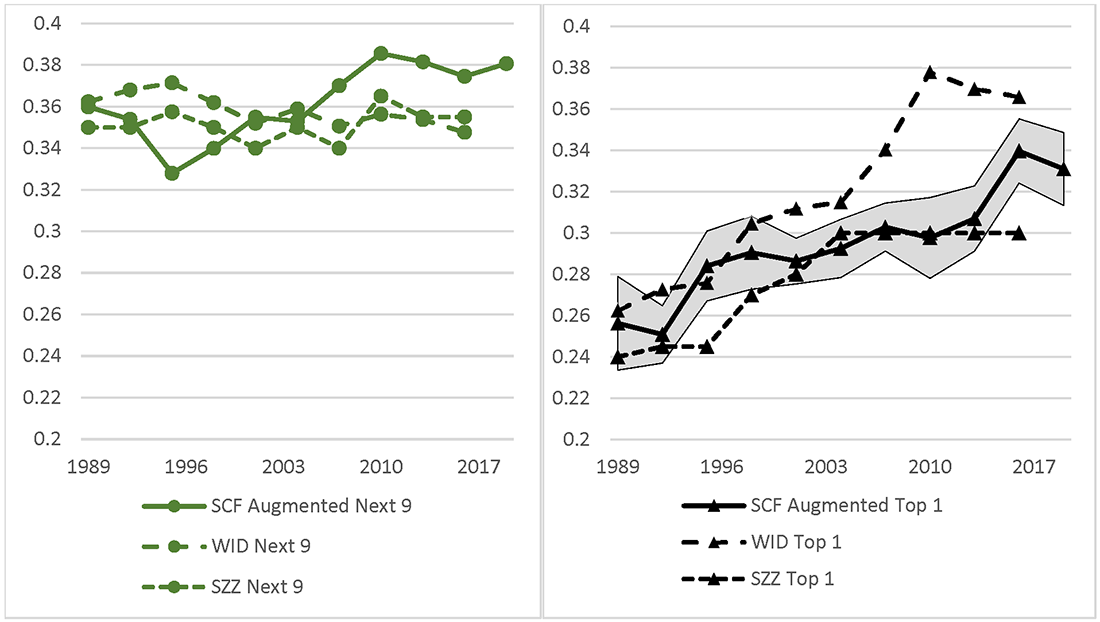
Source: Federal Reserve Board, Survey of Consumer Finances, WID, and Smith, Zidar, and Zwick (2020).
Notes: Figure shows share of wealth held by 90th to 99th wealth percentiles (Next 9) and wealthiest 1 percent (Top 1), 1989–2019. Shaded region shows bootstrap standard error around SCF top 1 share.
Smith, Zidar, and Zwick (2020)—hereafter "SZZ"—use a capitalization model that leverages the same income data as the WID but allows heterogeneous rates of return on assets in converting income to wealth—as discussed in Bricker, Henriques, and Hansen (2018)—and augments private business equity in the Financial Accounts. SZZ present detailed estimates for the top 10 percent, and we can compare these to the SCF and WID top 10 percent.
During the 1989–2019 period, the composition of wealth within the top 10 percent has shifted from the Next 9—the 90th to 99th percentiles—to the wealthiest 1 percent in both the SCF and WID (figure D). But the shift is more dramatic in the WID, such that in 2010, the share of wealth held by the wealthiest 1 percent overtook the share held by the next 9 percent, a pattern that has persisted through 2016; whereas in the SCF, the next 9 has held more wealth than the top 1 percent through 2019. The trend in concentration at the top is different over this period, too. Wealth concentration in the top 1 percent peaks in 2010 in the WID data—just following the Financial Crisis—while the peak in the SCF comes well into the ensuing recovery
As in the SCF, the Next 9 percent in the SZZ estimates own more wealth than the wealthiest 1 percent. But unlike the SCF and WID, there is no real trend toward the more wealth concentration, both within the top 10—comparing the Next 9 to the wealthiest 1 percent—and across time. By 2016, the SZZ estimates of concentration at the top are lower than both the SCF and WID.
Understanding when and why estimates of wealth concentration diverge is important if they are to be relied on to formulate policy, and these figures help illustrate the sensitivity of estimated wealth concentration, especially in the capitalization model parameters. Across the WID and SZZ estimates, wealth concentration among the top 1 percent ranges from 30 to 36.5 percent in 2016, with one set of estimates rapidly increasing from 2004–2016 and the other remaining stable over the same period.
Statistical variability in the SCF in wealth concentration estimates can stem from sampling—the expected range of estimates if a different set of families was sampled—and imputation (across the multiply imputed SCF data). The shaded region in figure D shows the 95 percent confidence interval around the SCF top 1 wealth share taking into account this variability. Notably, the shaded areas in the 2016 and 2019 data overlap, indicating that the true difference between the 2016 and 2019 SCF wealth concentration estimates may be zero.
From 1989 until the onset of the Financial Crisis in 2007, the three estimates of wealth concentration in the top 1 percent were at about the same level and moved together over time. But since the Financial Crisis, the estimates have been out of sync. Thus far, this disagreement in estimates can only partially be traced to differences in balance sheet composition of the wealthy and cannot be traced to differences in coverage of wealthy families (Bricker and Volz, 2020; Smith, Zidar, and Zwick, 2020).
Demographics and sources of wealth
The comprehensive information collected in the 2019 SCF allows detailed demographic breakdowns within and across the four wealth groups.11 For example, in 89 percent of families in the wealthiest 1 percent, the reference person identified as White. One percent or fewer of the wealthiest families identified as Black or Hispanic, and about 11 percent identified with another category, or with multiple race/ethnicity categories. Differences in wealth by race and ethnicity are discussed in detail in Bhutta, Chang, Dettling, and Hsu (2020).
The detailed economic data in the SCF also allow us to analyze sources of wealth. Almost three-fourths of the families in the wealthiest 1 percent own privately held businesses—a far greater share than any other group (table B)—and private business assets make up more than one-third of their balance sheet (figure A). As a share of assets, unrealized capital gains increases as wealth increases, as does age (table B). This finding and other recent work (Feiveson and Sabelhaus, 2018, and Robbins 2018) indicate that a significant portion of the economic gains at the top have come from returns on past investments.
The detailed data on inheritances, transfers, and parental education in the SCF can also give insights into intergenerational sources of wealth. Inherited wealth can play a direct role in wealth accumulation—with up to one-half of total wealth attributable to intergenerational transfers (Bastani and Waldenstrom, 2019; Feiveson and Sabelhaus, 2018)—and inheritances may also play a role in wealth concentration. In the 2019 SCF, the wealthiest families received the largest inheritances—$719,000, on average, at time of inheritance—and average inheritance amounts decline outside of the top wealth groups.
Growing up in a wealthy household may also impart other indirect advantages—through social connections, for example, or family loans—that play a role in wealth transmission. Inheritances that are expected, but not yet received, are informative about the wealth of the parents and other close relatives of SCF families. While expected inheritances should not directly influence the SCF family's wealth, as they are not yet received, table B indicates that the wealthiest families often come from families with significant wealth. Specifically, in 2019, wealthiest families expected to receive more than $940,000, on average, in future inheritances: an amount far greater than expected inheritances by the wealth groups lower in the distribution.
Table B. Characteristics of SCF families, by wealth group
Panel A. Demographics and portfolio of SCF families
Shares, except where noted
| Demographics | Portfolio | |||||||
|---|---|---|---|---|---|---|---|---|
| White | Black | Hisp. | Other | College graduate | Age (years) | Own a business | Unrealized capital gains | |
| Bottom 50 | 0.53 | 0.20 | 0.14 | 0.13 | 0.22 | 45 | 0.05 | 0.27 |
| Next 40 | 0.75 | 0.09 | 0.06 | 0.09 | 0.45 | 58 | 0.17 | 0.18 |
| Next 9 | 0.83 | 0.04 | 0.03 | 0.10 | 0.72 | 60 | 0.38 | 0.21 |
| Top 1 | 0.89 | 0.01 | 0.00 | 0.10 | 0.87 | 62 | 0.74 | 0.41 |
| All | 0.65 | 0.14 | 0.10 | 0.11 | 0.36 | 52 | 0.13 | 0.27 |
Panel B. Inheritances and family background of SCF families.
Shares, except where noted
| Inheritances (thousands of dollars) | Parent with College degree | ||
|---|---|---|---|
| Received | Expected | ||
| Bottom 50 | 9.7 | 29.4 | 0.28 |
| Next 40 | 45.9 | 60.1 | 0.33 |
| Next 9 | 174.2 | 266.6 | 0.47 |
| Top 1 | 719 | 941.1 | 0.58 |
| All | 46.2 | 72.2 | 0.32 |
Source: Federal Reserve Board, 2019 Survey of Consumer Finances.
The wealthiest families also have the highest share of parents with a college degree—another indicator of high socioeconomic status when growing up. Almost 60 percent of the wealthiest families had at least one parent that went to college, a share that falls to 47 percent for the next 9, 33 percent for the next 40, and 28 percent for the bottom 50. However, a family's own education is a stronger predictor of its wealth than the education of its parents, as nearly 90 percent of the wealthiest 1 percent include a reference person with a college degree.
Income
An important source of wealth for many families is saved income, and the SCF collects detailed information on pre-tax income received in the year prior to the survey, which follows closely from what families report on an income tax form.12 For example, changes between the 2016 and 2019 surveys describe changes in income between 2015 and 2018, respectively.13
Figure E describes the distribution of income across four income groups that mirror the wealth groups found earlier: families ranked in the bottom 50 percent of the income distribution, those in the "Next 40" percent (the 50th to 90th percentiles), those in the "Next 9" percent (90th to 99th percentiles), and the top 1 percent.
Comparing figure E to figure A, income is more evenly distributed than wealth. While the wealthiest 1 percent of families held about 33 percent of wealth in the 2019 SCF (figure A), the top 1 percent of SCF families by income received about 20 percent of total income (figure E).
But, as with wealth, the income distribution shows a longer-term trend toward more concentration at the top. Although the share of income received by the top 1 percent fell in 2019, it still remained substantially higher than earlier in the decade. In most surveys since 2007, the top 1 percent of families by income received 19 percent or more of total income; prior to 2007 the share of income received by the top 1 percent was never larger than 19 percent. And the share of income received by the Next 9 income group—90th–99th percentiles—has continued to increase since 1989.
Between the 2016 and 2019 surveys, the share of income received by the Bottom 50 and Next 40 income groups both increased, reversing a decade-long decline in the income share for those groups. Both, though, increased from their historical lows and their 2019 income shares are similar to the 2010–13 period.
Share earned by income group
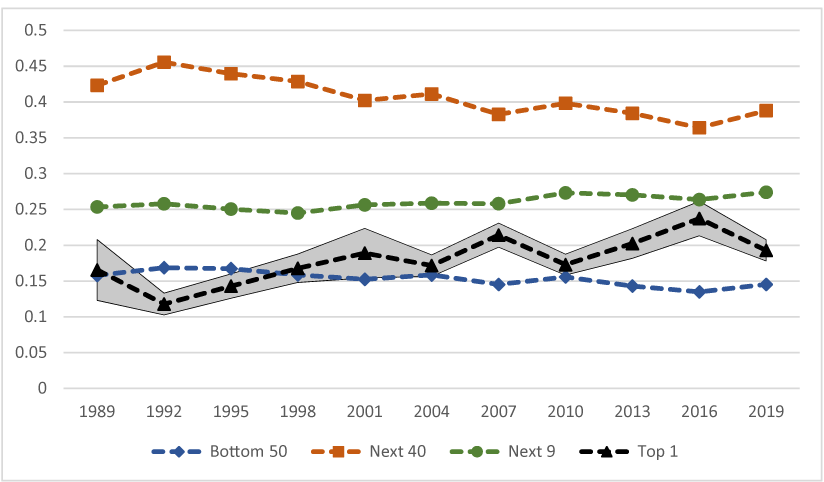
Source: Federal Reserve Board, Survey of Consumer Finances.
Notes: Figure shows the share of income earned by the Bottom 50 income percentiles, 50th–90th income percentiles (Next 40), 90th to 99th income percentiles (Next 9) and Top 1 percent, 1989–2019. Shaded region shows bootstrap standard errors around SCF top 1 income share.
Income reported on a tax form can be informative about well-being, but the concept of income that best measures a family's well-being most likely includes components that are fully taxed (such as wages) or partially taxed (such as Social Security), along with untaxed components (like employer-paid health insurance premiums or some government transfers). Such components are included in other efforts to create "more complete" measures of income, including the distributional national accounts (DINA) project (Piketty, Saez, and Zucman, 2018).
Accordingly, we augment SCF Bulletin income to include some non-taxable sources of income: employer-paid health insurance premiums as well as Medicare and Medicaid receipt and other government assistance. We do so by allocating National Income and Product Account aggregates across SCF families using the detailed information collected in the SCF on health insurance coverage, age, and income to distribute employer health insurance, Medicare, Medicaid, and other government subsidies (see Bricker, Henriques, Krimmel, and Sabelhaus, 2016, for more information).
These augmented SCF income estimates have a comparable distribution to the national income concept found in the WID database. Both show a somewhat increasing pattern in income concentration in the top 1 percent during the 1989–2019 period and a declining share of income to families outside of the top 10 percent, similar to but to a lesser extent than household wealth in figure C and D and Bulletin income in figure E.
Share earned by income group
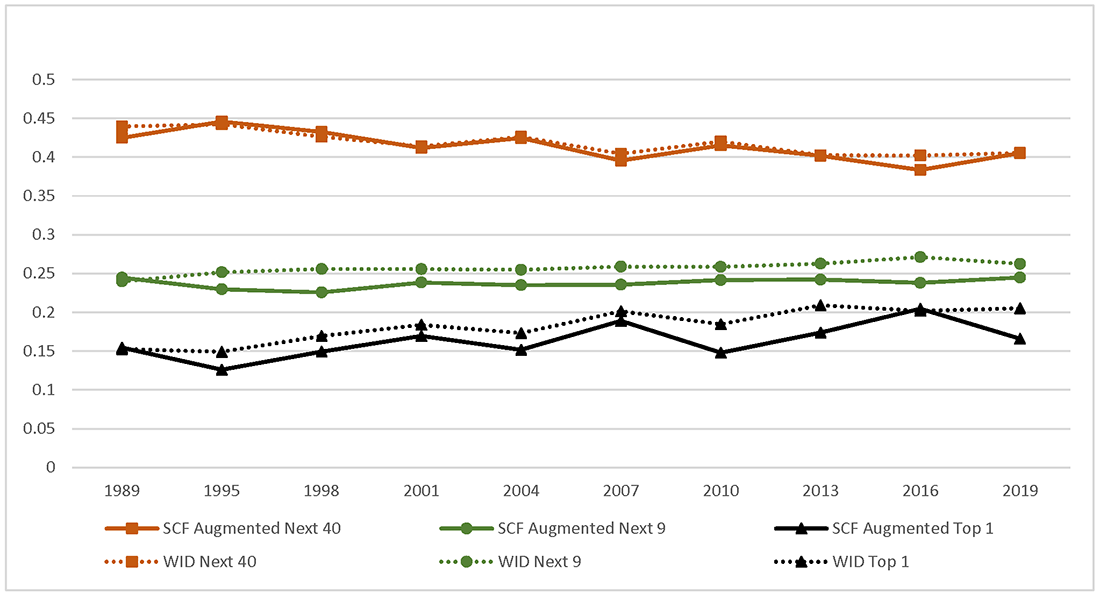
Source: Federal Reserve Board, Survey of Consumer Finances, and WID.
Joint distribution of income and wealth
Both income and wealth can describe a family's economic well-being, and the distributional analysis shown so far shows how that well-being is spread across the U.S. population. Unique to the SCF, we can also see the overlap in the two distributions, and identify how many families are at the top of both.
The table below describes the share of families in a given income group by wealth group—the marginal distribution of income with respect to wealth. (The percentages in each column sum to 1, except for rounding errors.) The diagonal elements pertain to families that are in the same segment of the distribution for both measures. Of the wealthiest 1 percent, about half (49 percent) are also among the families with the highest incomes, and 41 percent are in the Next 9 income group. Nearly 10 percent of the wealthiest families, then, have income that puts them in the bottom 90 percent.
Of the current methods employed to characterize the top of the wealth distribution, the SCF is the only one that does not rely on income to measure wealth, and instead collects a direct measure of both wealth and income. The joint distribution in methods that "capitalize" income into wealth rely on models to map income to wealth, and the recent modelling work—from Bricker, Henriques, and Hansen (2018) to Saez and Zucman (2019) to Smith, Zidar, and Zwick (2020)—indicates that there is much work to be done before the income-to-wealth relationship is fully understood.
Table C. Share of families in income group, by wealth group, 2019 SCF
| Income groups | Wealth groups | |||
|---|---|---|---|---|
| Bottom 50 | Next 40 | Next 9 | Top 1 | |
| Bottom 50 | 0.72 | 0.34 | 0.03 | 0.04 |
| Next 40 | 0.27 | 0.56 | 0.46 | 0.05 |
| Next 9 | 0.01 | 0.10 | 0.47 | 0.41 |
| Top 1 | 0 | 0 | 0.05 | 0.49 |
| All | 1.00 | 1.00 | 1.00 | 1.00 |
Source: Federal Reserve Board, 2019 Survey of Consumer Finances.
Note: Table displays the share of families in augmented wealth groups that are also in income groups. For example, 49 percent of the top 1 by wealth are also in the top 1 by augmented income. Columns sum to 1, though may not due to rounding.
Conclusion
This note provides the first look at the wealth distribution since 2016 (figure B). This note also lays out the best practices for augmenting the SCF wealth concept to characterize—and be more comparable to other measures of—the full U.S. wealth distribution. The data collected in the 2010–2016 SCF surveys indicated that the sustained economic growth that followed the Great Recession had initially accrued primarily to the wealthiest families. These 2019 data were collected at the end of the longest economic expansion on record, when growth spread more equitably to the larger segments of the distribution.
Overall, the 2019 SCF data mostly show small changes between the 2016 and 2019 SCF distributions. Wealth concentration in the top 1 percent of families is still near the high point in the historical 1989–2019 SCF time series, and concentration in the top 10 percent is unchanged. Although wealth concentration did not increase between 2016 and 2019, the gains that accrued to the rest of the distribution did little to reduce the large existing disparities.
Income concentration in the top 1 percent fell but remained at the typical levels seen since the 2007 SCF. However, some of the income share earned by the top 1 percent shifted to the bottom 90 percent of the income distribution, reversing a nearly decade-long decline in the income share for that group.
References
Alvaredo, Facundo, Anthony Atkinson, Lucas Chancel, Thomas Piketty, Emmanuel Saez, and Gabriel Zucman (2016). "Distributional National Accounts (DINA) Guidelines: Concepts and Methods used in WID.world," WID.world working paper series, No. 2016/1.
Auten, Gerald, and David Splinter (2020). "Income Inequality in the United States: Using Tax Data to Measure Long-term Trends," mimeo.
Batty, Michael, Jesse Bricker, Joseph Briggs, Elizabeth Holmquist, Susan McIntosh, Kevin Moore, Eric Nielsen, Sarah Reber, Molly Shatto, Kamila Sommer, Tom Sweeney, and Alice Volz (2019). "Introducing the Distributional Financial Accounts of the United States," FEDS Paper No. 2019-017.
Bastani, Spencer, and Daniel Waldenstrom (2019). "Salience of Inherited Wealth and the Support for Inheritance Taxation," CESifo Working Paper No. 7482.
Bhutta, Neil, Jesse Bricker, Andrew C. Chang, Lisa J. Dettling, Sarena Goodman, Joanne W. Hsu, Kevin B. Moore, Sarah Reber, Alice Henriques Volz, and Richard A. Windle (2020). "Changes in U.S. Family Finances from 2016 to 2019: Evidence from the Survey of Consumer Finances," Federal Reserve Bulletin, September, Vol. 106, No. 5.
Bhutta, Neil, Andrew C. Chang, Lisa J. Dettling, and Joanne W. Hsu (2020). "Disparities in Wealth by Race and Ethnicity in the 2019 Survey of Consumer Finances," FEDS Notes. Washington: Board of Governors of the Federal Reserve System, September 28, 2020, https://doi.org/10.17016/2380-7172.2797
Board of Governors of the Federal Reserve System (2020). Statistical Release Z.1, "Financial Accounts of the United States,".
Bricker, Jesse, Alice Henriques, Jacob Krimmel, and John Sabelhaus (2016). "Measuring Income and Wealth at the Top Using Administrative and Survey Data," Brookings Papers on Economic Analysis, Spring.
Bricker, Jesse, Alice Henriques, and Kevin B. Moore (2017). "Updates to the Sampling of Wealthy Families in the Survey of Consumer Finances," FEDS Working Paper No. 2017-114.
Bricker, Jesse, Alice Henriques, and Peter Hansen (2018). "How Much Has Wealth Concentration Grown in the United States? A Re-examination of Data from 2001-2013," FEDS Working Paper No. 2018-024.
Bricker, Jesse, Peter Hansen, and Alice Henriques Volz (2019). "Wealth Concentration in the U.S. after Augmenting the Upper Tail of the Survey of Consumer Finances," Economic Letters Vol 184.
Feiveson, Laura, and John Sabelhaus (2018). "How Does Intergenerational Wealth Transmission Affect Wealth Concentration?" FEDS Paper No. 2018-06-01.
Kennickell, Arthur. (1999). "Using income to predict wealth." Technical report, Board of Governors of the Federal Reserve System (U.S.).
Kopczuk, Wojciech, and Emmanuel Saez (2004). "Top wealth shares in the United States, 1916-2000: Evidence from estate tax returns," National Tax Journal, 47(2):445–487.
Lampman, R. J. (1962). "The Share of Top Wealth-Holders in National Wealth, 1922-56." NBER Books.
Piketty, Thomas, and Emmanuel Saez (2003). "Income Inequality in the United States, 1913-1998," Quarterly Journal of Economics, vol. 118, no. 1: 1-39.
Piketty, Thomas, Emmanuel Saez, and Gabriel Zucman (2018). "Distributional National Accounts: Methods and Estimates for the United States," Quarterly Journal of Economics, vol. 133, no. 2: 553-609.
Robbins, Jacob (2018). "Capital gains and the distribution of income in the United States," mimeo.
Sabelhaus, John, and Alice Henriques Volz (2019). "Are Disappearing Employer Pensions Contributing to Rising Wealth Inequality?" FEDS Notes, February 1, 2019.
Sabelhaus, John, and Alice Henriques Volz (2020). "Social Security Wealth, Inequality, and Lifecycle Saving," NBER Working Paper 27110.
Saez, Emmanuel, and Gabriel Zucman (2016). "Wealth Inequality in the United States since 1913: Evidence from Capitalized Income Tax Data," Quarterly Journal of Economics, vol. 131, no. 2, pp. 519-578.
Saez, Emmanuel, and Gabriel Zucman (2019). "Progressive Wealth Taxation," Brookings Papers on Economic Analysis, Fall.
Smith, Matthew, Owen Zidar, and Eric Zwick (2020). "Top Wealth in the United States: New Estimates and Implications for Taxing the Rich." Mimeo.
Vermuelen, Philip (2018). "How fat is the top tail of the wealth distribution?" The Review of Income and Wealth, 64(2):357–387.
1. See Bricker, Henriques, and Moore (2017) for more information on the SCF sampling process and Bricker, Henriques, Krimmel, and Sabelhaus (2016) for more information on top-end coverage in the SCF. The SCF cannot sample the Forbes 400, but the results shown here include our best estimate of the wealth of these families. Return to text
2. The main results of the 2019 SCF as well as information on the timing of the interviews are found in Bhutta, et al. (2020). Additional details concerning the data and definitions used in this note can be found in this article and its accompanying appendix. Return to text
3. For context, we also provide a comparison between the historical evolution of SCF wealth concentration estimates and those from tax records that are currently available only through 2016. Return to text
4. DB pensions are often called "traditional pensions". The amount of retirement payments are typically based on years of employment multiplied by a share of pay, and an amount that is a function of annual income. These plans are managed by employers—with assets held in reserve to pay future benefits—so employees typically have access to information about future benefits but not account values. In contrast, DC plans are owned by employees, such as 401(k), 403(b), or similar plans which are managed by the employer, along with IRA accounts, which are managed by the individual. Return to text
5. Notably, this adjustment excludes social security, another important source of retirement-age consumption funding on which many families depend. But, unlike DB pensions, there are no legal claims to future Social Security payments. See Board of Governors of the Federal Reserve System (2020), Statistical Release Z.1, "Financial Accounts of the United States," for the full Financial Accounts data. Return to text
6. More than $19 trillion in asset reserves are allocated to fund DB pension obligations to households in the 2019 Q3 Financial Accounts, representing about 15% of all household wealth. Allocating these DB reserves to the 2019 SCF also adds about 15 percent to the SCF aggregate household wealth as the SCF aggregate net worth typically lines up well with aggregate net worth in table B.101.h of the Financial Accounts (Batty et al 2019). This stock of DB pension wealth is the accrued pension benefit obligations (ABO) of pension plans (i.e. all benefits accrued to date for workers), which includes both funded and unfunded obligations. Pension accounting principles and laws differ for private and public sector employers, leading to higher funding levels for private sector plans. Including both funded and unfunded obligations here allocates all pension benefits workers have accrued, since they are liabilities on the balance sheet of firms, regardless of whether the assets have been set aside (for further discussion of DB concept included see Sabelhaus and Volz, 2019). The optimal choice of pension entitlement measure reflects one's view on the risk of firm (or government) default on pension obligations. Return to text
7. Bricker, Hanson, and Volz (2019), Vermeulen (2018), and Kennickell (1999) each show that any under-coverage in the baseline SCF does not arise until the extreme top, as the wealthiest SCF families have wealth comparable to the lower end of the Forbes 400. Thus, adding the Forbes 400 increases aggregate household wealth by $2.65 trillion to total 2019 SCF wealth, as about $300 billion of Forbes wealth was already represented by sampled SCF families. Return to text
8. Note that first including DB pensions brings top 1 share down to 31.7 percent, and then including Forbes families brings share up to 33.1. Aggregate DB wealth is far greater than Forbes wealth (19 trillion to 3 trillion). Return to text
9. The Distributional Financial Accounts (DFA) distribute the aggregate Financial Accounts based on the SCF distribution of assets and debts (see Batty et al 2019), and updated DFA wealth concentration results will be in the upcoming release, covering data through 2020 Q2. The only official recording of wealth that exists in the U.S. comes from an estate tax (if applicable) at death. While these data have been widely used in the past to estimate wealth concentration (e.g., Lampman, 1962, Kopczuk and Saez, 2003), the estate tax data from the past 15 years have relatively small sample sizes and are less representative than past data as estate tax filing thresholds have increased. Return to text
10. See www.wid.world and Alvaredo et al (2016) for more information. Note that the augmented SCF wealth concept used here is more comparable to the WID wealth concept. Return to text
11. This analysis is based on solely the 2019 SCF and thus excludes the Forbes families from earlier figures. Return to text
12. The Bulletin income concept is the pre-tax sum of wages, interest (taxable and non-taxable), dividends, capital gains, pass-through income from businesses, pension, Social Security, and Supplemental Security Income payments, retirement account withdrawals, and some forms of transfer income. Return to text
13. Over this period, there was a change in tax rates brought on by the Tax Cuts and Jobs Act of 2017. Return to text
Bricker, Jesse, Sarena Goodman, Kevin B. Moore, and Alice Henriques Volz (2020). "Wealth and Income Concentration in the SCF: 1989–2019," FEDS Notes. Washington: Board of Governors of the Federal Reserve System, September 28, 2020, https://doi.org/10.17016/2380-7172.2795.
Disclaimer: FEDS Notes are articles in which Board staff offer their own views and present analysis on a range of topics in economics and finance. These articles are shorter and less technically oriented than FEDS Working Papers and IFDP papers.