Timelines of Policy Actions and Communications:
Summary of Economic Projections
Since 1979, the Federal Reserve has published a summary of individual economic projections from various Board members, FOMC members, or FOMC participants in the semiannual Monetary Policy Report (MPR) to the Congress.1 With the introduction of the Summary of Economic Projections (SEP) in 2007, the FOMC increased the frequency of the releases of policymaker projections, expanded the set of economic variables included, and extended the forecast horizon. Since the advent of the SEP, the economic projections reported in the MPR correspond to those in the most recently released SEP.
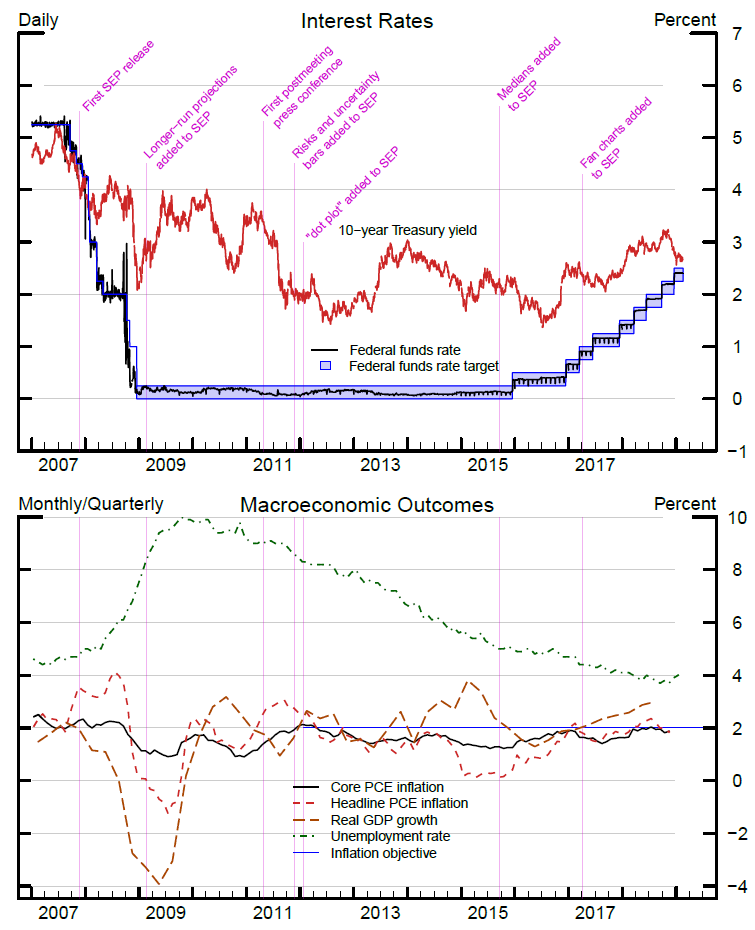
- November 14, 2007: The FOMC announces in a statement that it will increase the frequency and expand the content of economic projections released to the public. That same day, Chairman Bernanke provides further details in a speech. Compared with the projections previously released semiannually in the MPR, the quarterly SEP has a longer forecast horizon (by one year), includes projections for headline PCE inflation, and discontinues projections for nominal GDP growth. The SEP information also includes forecast errors (defined as root mean squared errors) of various private and government projections made over the past 20 years.
- November 20, 2007: The SEP is published for the first time, appearing as an addendum to the minutes of an FOMC meeting.
- February 18, 2009: Longer-run projections for real GDP growth, the unemployment rate, and headline inflation are added to the SEP.
- April 27, 2011: With the beginning of quarterly post-FOMC meeting press conferences, a table of key SEP statistics is released along with the FOMC postmeeting statement.
- November 22, 2011: Histograms are added in the SEP addendum to the FOMC minutes. These histograms show the distribution of participants' assessments of the balance of risks around their projections and of the level of uncertainty relative to the past 20 years.
- January 25, 2012 (PDF): Participants' assumptions about the appropriate level of the federal funds rate at year-ends and in the longer run are added to the SEP. Moreover, the SEP summary accompanying the postmeeting statement now includes a depiction of individual assumptions for the federal funds rate; this figure is informally known as the "dot plot." These changes coincide with the first annual release of the FOMC's Statement on Longer-Run Goals and Monetary Policy Strategy.
- September 17, 2015: Median statistics are added both in the SEP summary accompanying the FOMC statement and in the SEP addendum to the FOMC minutes, complementing central tendencies and ranges.
- April 5, 2017: "Fan charts" showing forecast errors around the median SEP projections are added to the SEP addendum to the FOMC minutes.
Sources: FRED, Federal Reserve Bank of St. Louis.
Notes: Headline and core PCE inflation are shown on a 12-month basis. Real GDP growth is shown on a four-quarter change basis. The unemployment rate is on a monthly basis.
1. The publication of economic projections is required by the Humphrey-Hawkins Full Employment and Balanced Growth Act, which was signed into law in October 1978. The term "FOMC participants" encompasses the members of the Board of Governors and all of the presidents of the 12 Federal Reserve Banks. The term "FOMC members" includes the voting members of the FOMC--namely, the members of the Board of Governors of the Federal Reserve System, the president of the Federal Reserve Bank of New York, and 4 of the remaining 11 Reserve Bank presidents who serve one-year terms on a rotating basis. Return to text