FEDS Notes
November 15, 2017
The Potential Increase in Corporate Debt Interest Rate Payments from Changes in the Federal Funds Rate
Ashish Kumbhat, Francisco Palomino, and Ander Perez-Orive1
1. Summary
This note studies the response of interest expenses of U.S. nonfinancial corporations to an increase in interest rates. Under mild assumptions, a rise in the federal funds rate through 2019--as projected by the June 2017 Summary of Economic Projections (SEP)--is estimated to have modest aggregate and sectoral effects on the debt interest burden of nonfinancial corporations.
Higher interest expenses arise from new debt issued at higher rates or from higher rates on existing floating-rate debt. To calculate the fraction of debt exposed to higher rates, this analysis uses public and regulatory data on the total amount of outstanding debt, its breakdown into fixed and variable-rate, and its maturity structure. About 98 percent of outstanding corporate bonds (roughly $4.5 trillion) have fixed interest rates, and approximately 85 percent of corporate loans outstanding (roughly $2.2 trillion) have variable interest rates. The fractions of the total amounts outstanding of fixed-rate bonds and loans maturing before the end of 2020 are roughly 25 percent and 66 percent, respectively.
The increase in the federal funds rate from 1-1/4 percent to 3 percent by 2019 as implied by the projections in the June 2017 SEP would translate into an increase in interest payments of $2 billion in 2017, $15 billion in 2018, and $37 billion in 2019, relative to a scenario in which the federal funds rate remains at 1-1/4 percent. The increase implies that the aggregate interest coverage ratio--the ratio of earnings before interest and taxes (EBIT) to interest expenses on bonds and loans--for the U.S. nonfinancial sector will decline in 2019 from 4.6 in a scenario in which rates remain at current levels to 4.1 in a scenario in which rates evolve according to the SEP.
Corporations in different economic sectors are not equally vulnerable to an increase in interest rates. Focusing on the three sectors with the highest debt exposure, the projected increase in the policy rate is estimated to lower interest coverage ratios by 2019 from roughly 2.0 to 1.5 in the real estate sector and from 2.7 to 2.5 in the utilities sector. The energy sector has experienced negative interest coverage ratios in recent years, and the change in this ratio as a result of the projected rate hikes has negligible implications relative to those associated to low energy prices and weak earnings. In summary, significant vulnerabilities to higher rates appear to be restricted to the real estate sector, mostly because of the large fraction of floating-rate debt in that sector.
These estimates rely on three important assumptions and come with a caveat. First, the total debt and earnings levels and the proportions of bonds to loans and fixed- to floating-rate debt are not affected by the assumed change in the path of the federal funds rate. Second, the outstanding fixed-rate debt maturing over the next three years is rolled over at expected interest rates prevailing each year. Third, increases in the federal funds rate occur in the middle of each year. The limitations of these assumptions are briefly discussed at the end of this note. Finally, as a caveat, the analysis cannot rule out that some individual firms may experience difficulties in the face of increasing rates.
2. Aggregate Analysis
a. Nonfinancial Corporate Loans and Bonds
The analysis uses regulatory and public data on corporate loans and bonds to break down the portion of outstanding corporate debt with variable and fixed rates. This breakdown is used in combination with the maturity structure of this debt to estimate the change in interest expenses implied by the June 2017 SEP projected path for the federal funds rate through 2019.
Corporate Loans
As of March 2017, the total amount of outstanding corporate loans (term loans and lines of credit) is roughly $2.6 trillion, of which approximately 15 percent ($408 billion) have fixed interest rates and about 85 percent ($2.2 trillion) have floating rates according to FR Y-14 data.2 For floating-rate loans, the reference rates are typically the three-month LIBOR and the prime rate, which move roughly one-for-one with the federal funds rate. An increase in the federal funds rate is thus likely to affect the interest expenses for a large fraction of corporate loans.
Table 1: Amount Outstanding of Nonfinancial Corporate Loans
| Total outstanding | |
|---|---|
| Fixed rate | 408 |
| Floating rate | 2,188 |
| Total utilized | 2,596 |
Source: Y-14 Regulatory Reporting; Federal Reserve - Financial Accounts of the United States - Z.1.
Two factors may weaken the response of interest expenses of floating-rate loans to changes in the federal funds rate: interest rate floors or ceilings and infrequent rate resetting.3 Floors and ceilings stipulate minimum and maximum levels for the reference rate (LIBOR or prime rate) below and above which interest payments are capped, respectively. While most term loans and lines of credit do not have ceilings, the majority of term loans with floating rates, and a nontrivial fraction of lines of credit, have floors. In the case of LIBOR-based floating-rate corporate loans, the vast majority of loans breached their floors as the LIBOR rate reached 100 basis points in early January 2017.
Rates on term loans and lines of credit typically reset to the level of their reference rate on a quarterly basis. This factor might limit the short-term effect of the SEP-projected rate hikes, as it could take a few months before the rate hike translates into increases in the floating interest rates of loans. However, quarterly resetting does not weaken the longer-term reaction of interest expenses to further interest rate increases.
Fixed-rate loans might not be immune to interest rate increases either. Their relatively short maturities--66 percent of them mature before 2021 (table 2)--open the possibility that a significant portion of the $408 billion in outstanding fixed-rate loans will be rolled over at interest rates that reflect the policy rate increases.
Table 2: Maturity of Nonfinancial Corporate Loans
| Maturity | % of total fixed-rate loans | % of total floating-rate loans |
|---|---|---|
| 2017-2018 | 37 | 6 |
| 2019-2020 | 29 | 22 |
| 2021-2022 | 22 | 43 |
| 2023-2024 | 4 | 28 |
| 2025+ | 8 | 1 |
Source: Y-14 Regulatory Reporting; S&P LCD; Bloomberg.
Corporate Bonds
According to data from the Mergent's Fixed Income Security Database (FISD), the total amount outstanding of investment- and speculative-grade U.S. nonfinancial corporate bonds is, as of June 2017, roughly $3.4 trillion and $920 billion, respectively. Most of these bonds pay fixed coupons, as bonds with floating rates represent only 2.8 percent and 1.8 percent of the total amount outstanding of investment- and speculative-grade bonds, respectively.4 Therefore, most of the potential increase in interest expenses from these bonds would result from rolling over maturing debt at a higher fixed coupon.5
Bonds that mature in 2017 and 2018 account for about 9 percent and 5 percent of the total amount outstanding of investment- and speculative-grade bonds, respectively (table 3). In total, roughly $380 billion, or 8.5 percent, of the total amount outstanding of bonds would be directly exposed to increased interest expenses in the next two years and, additionally, $335 billion in 2019.
Table 3: Amount Outstanding of Nonfinancial Corporate Bonds
| Maturity | Investment grade | Speculative Grade | All* |
|---|---|---|---|
| 2017-2018 | 318 (9.4%) | 43 (4.8%) | 378 (8.5%) |
| 2019-2020 | 525 (15.5%) | 159 (17.0%) | 712 (16.0%) |
| 2021-2022 | 537 (15.8%) | 270 (29.6%) | 844 (18.9%) |
| 2023-2024 | 352 (10.4%) | 244 (26.8%) | 616 (13.8%) |
| 2025+ | 1,660 (48.9%) | 199 (21.9%) | 1,917 (42.9%) |
Note: Amounts are in USD billions. Figures in parenthesis are percentages of total amount outstanding by credit category.
* "All" includes unrated bonds. Return to text
Source: FISD.
b. Estimated Increase in Interest Expenses
This section provides estimates of the increase in interest expenses for nonfinancial corporations under the federal funds rate path implied by the June 2017 SEP, which projects a tightening of 24 bp in the policy rate in 2017, 70 bp in 2018, and 90 bp in 2019. It is assumed that all floating-rate loans reset immediately to their new reference rate and that they are rolled over once they mature. Similarly, fixed-rate bonds and loans are assumed to be rolled over immediately after maturity with a new time to maturity equal to the weighted average maturity of bonds and loans in the sample, respectively, and a coupon rate equal to current market yields plus the projected cumulative federal funds rate hike at the time of rollover.6 In addition, it is assumed that loan and bond amounts outstanding remain constant; 100 percent of loans surpass their LIBOR reference rate floors; and the rate hikes in 2017, 2018, and 2019 occur in the middle of the year.
The additional interest expenses on corporate debt are estimated to be $2 billion in 2017 and reach $37 billion in 2019 (table 4). These amounts are equivalent to increases of 1 and 12 percent, respectively, relative to a scenario in which the federal funds rate remains at 1-1/4 percent until 2019.
Table 4: Estimated Additional Interest Expenses
| Federal funds rate change* | Expected additional interest expense | |||
|---|---|---|---|---|
| Bonds | Bank loans | All | ||
| 2017 | 24 | 35 | 1,763 | 1,798 |
| 2018 | 94 | 898 | 14,440 | 15,338 |
| 2019 | 184 | 4,143 | 32,989 | 37,132 |
* "Change" refers to the cumulative change in basis points. Return to text
Source: FISD.
Figure 1 plots the evolution from 2000 to 2016 of the interest coverage ratio, defined as the ratio of EBIT to interest expenses.7 The coverage ratio has decreased on average since 2013, mostly driven by higher leverage, but is still high by historical standards. An increase in the federal funds rate, as implied by the path forecast in the June 2017 SEP, is estimated to decrease the coverage ratio to 4.1 by the end of 2019 compared to a coverage ratio of 4.6 in the scenario where the federal funds rate stays at 1-1/4 percent for the next three years.
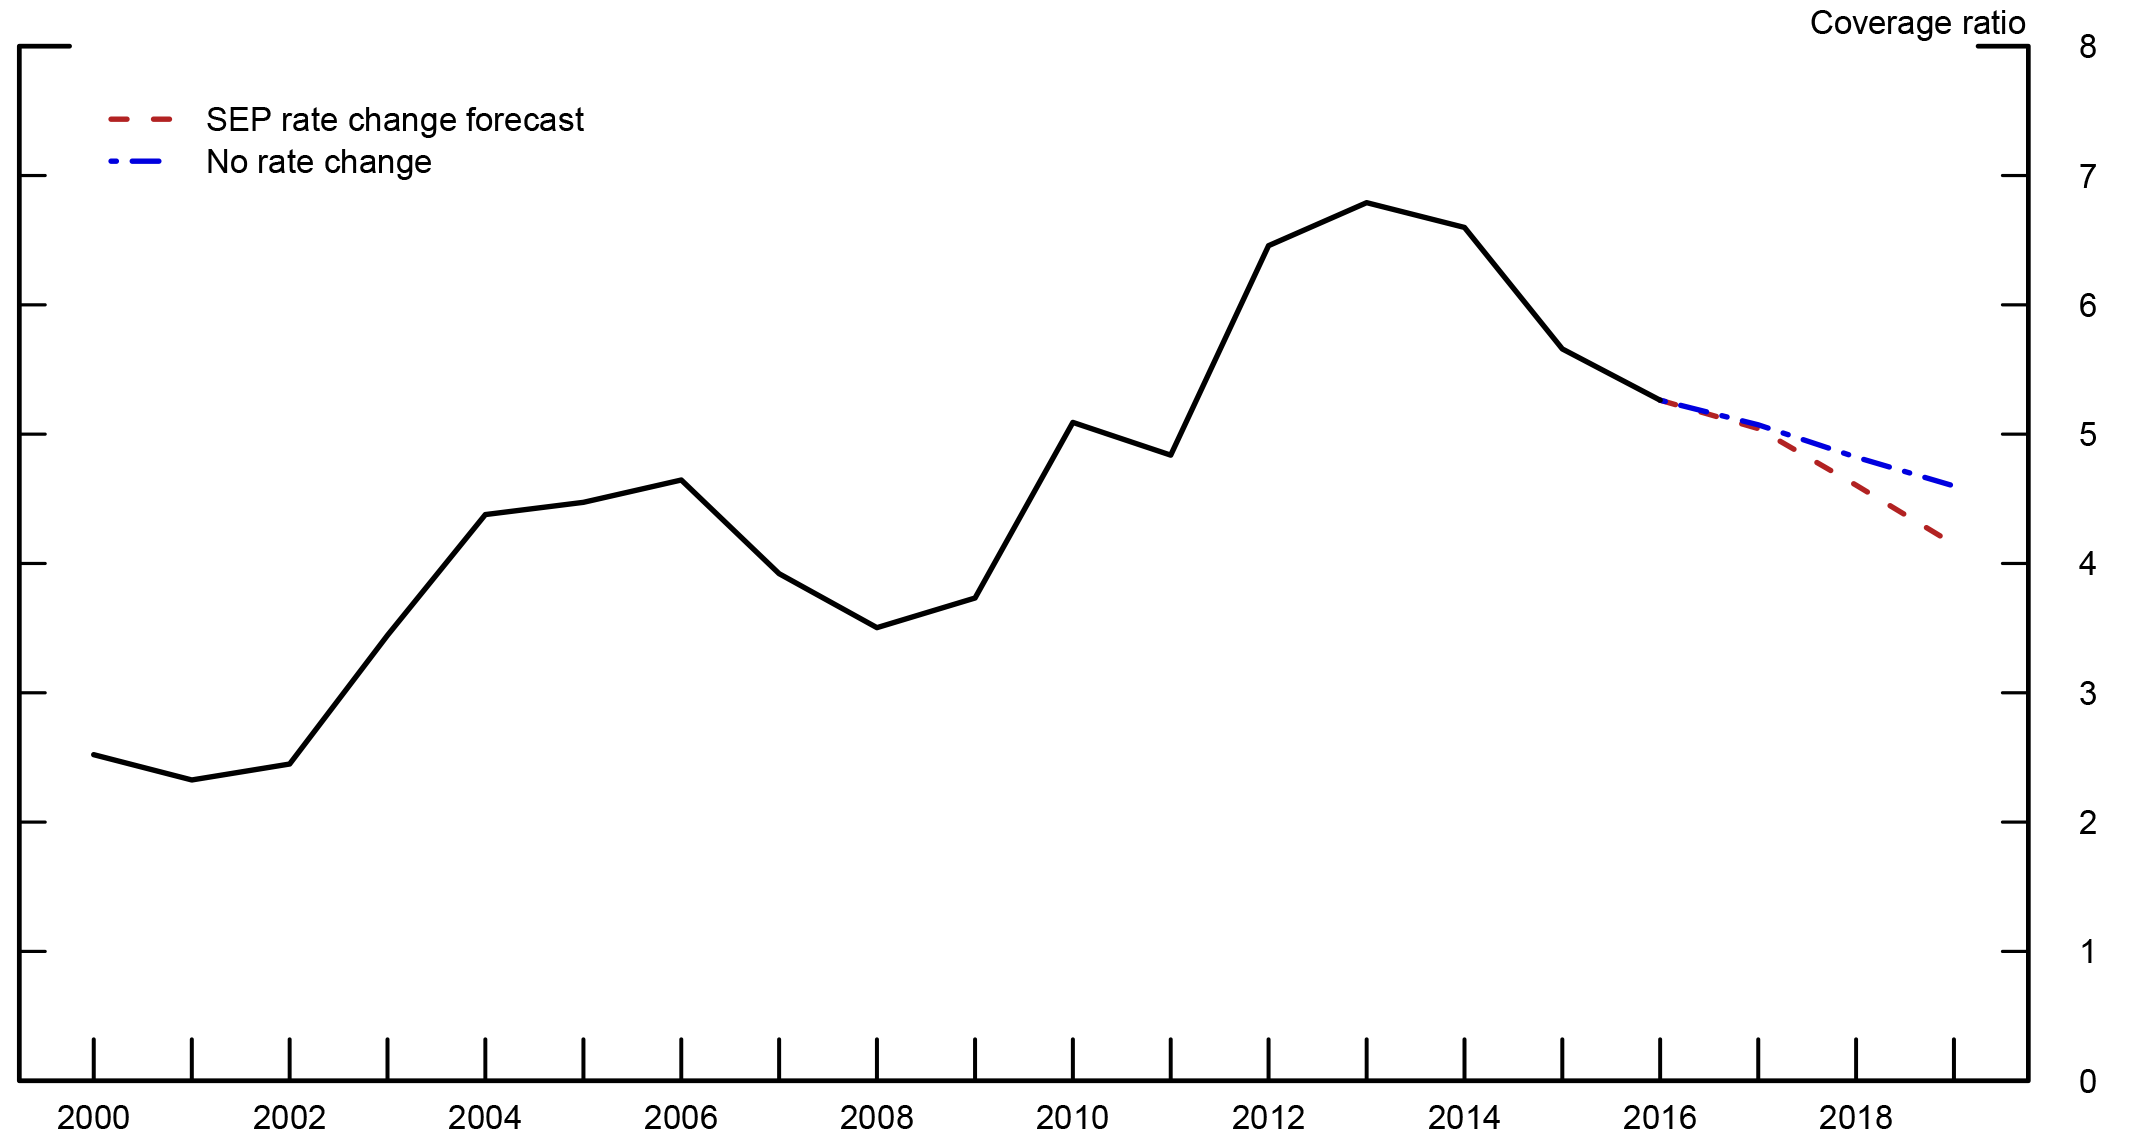
Source: Y-14 Regulatory Reporting; S&P Compustat-Capital IQ; FISD; Federal Reserve - Financial Accounts of the United States - Z.1.
3. Sectoral Analysis
The modest vulnerability found for the aggregate nonfinancial corporate sector can mask more significant risks in some industries. In particular, sectors with high leverage and high exposure to interest rate changes may be more sensitive to an increase in interest rates. Ippolito, Ozdagli, and Perez-Orive (2017) show that monetary-policy-induced changes to interest rates significantly affect the balance sheet liquidity, valuation, and investment of financially constrained firms that use floating-rate debt relative to similarly indebted firms with fixed-rate debt. Figure 2 shows the levels of the interest rate coverage ratios in 2015 using information from the Bureau of Economic Analysis. The low interest coverage ratios of the energy (mining), utilities, and real estate sectors make them of particular interest.8 In a similar vein, the April 2017 Global Financial Stability Report of the IMF argues that the rise in firms' net leverage in these three sectors since the financial crisis makes them vulnerable to an increase in interest rates.
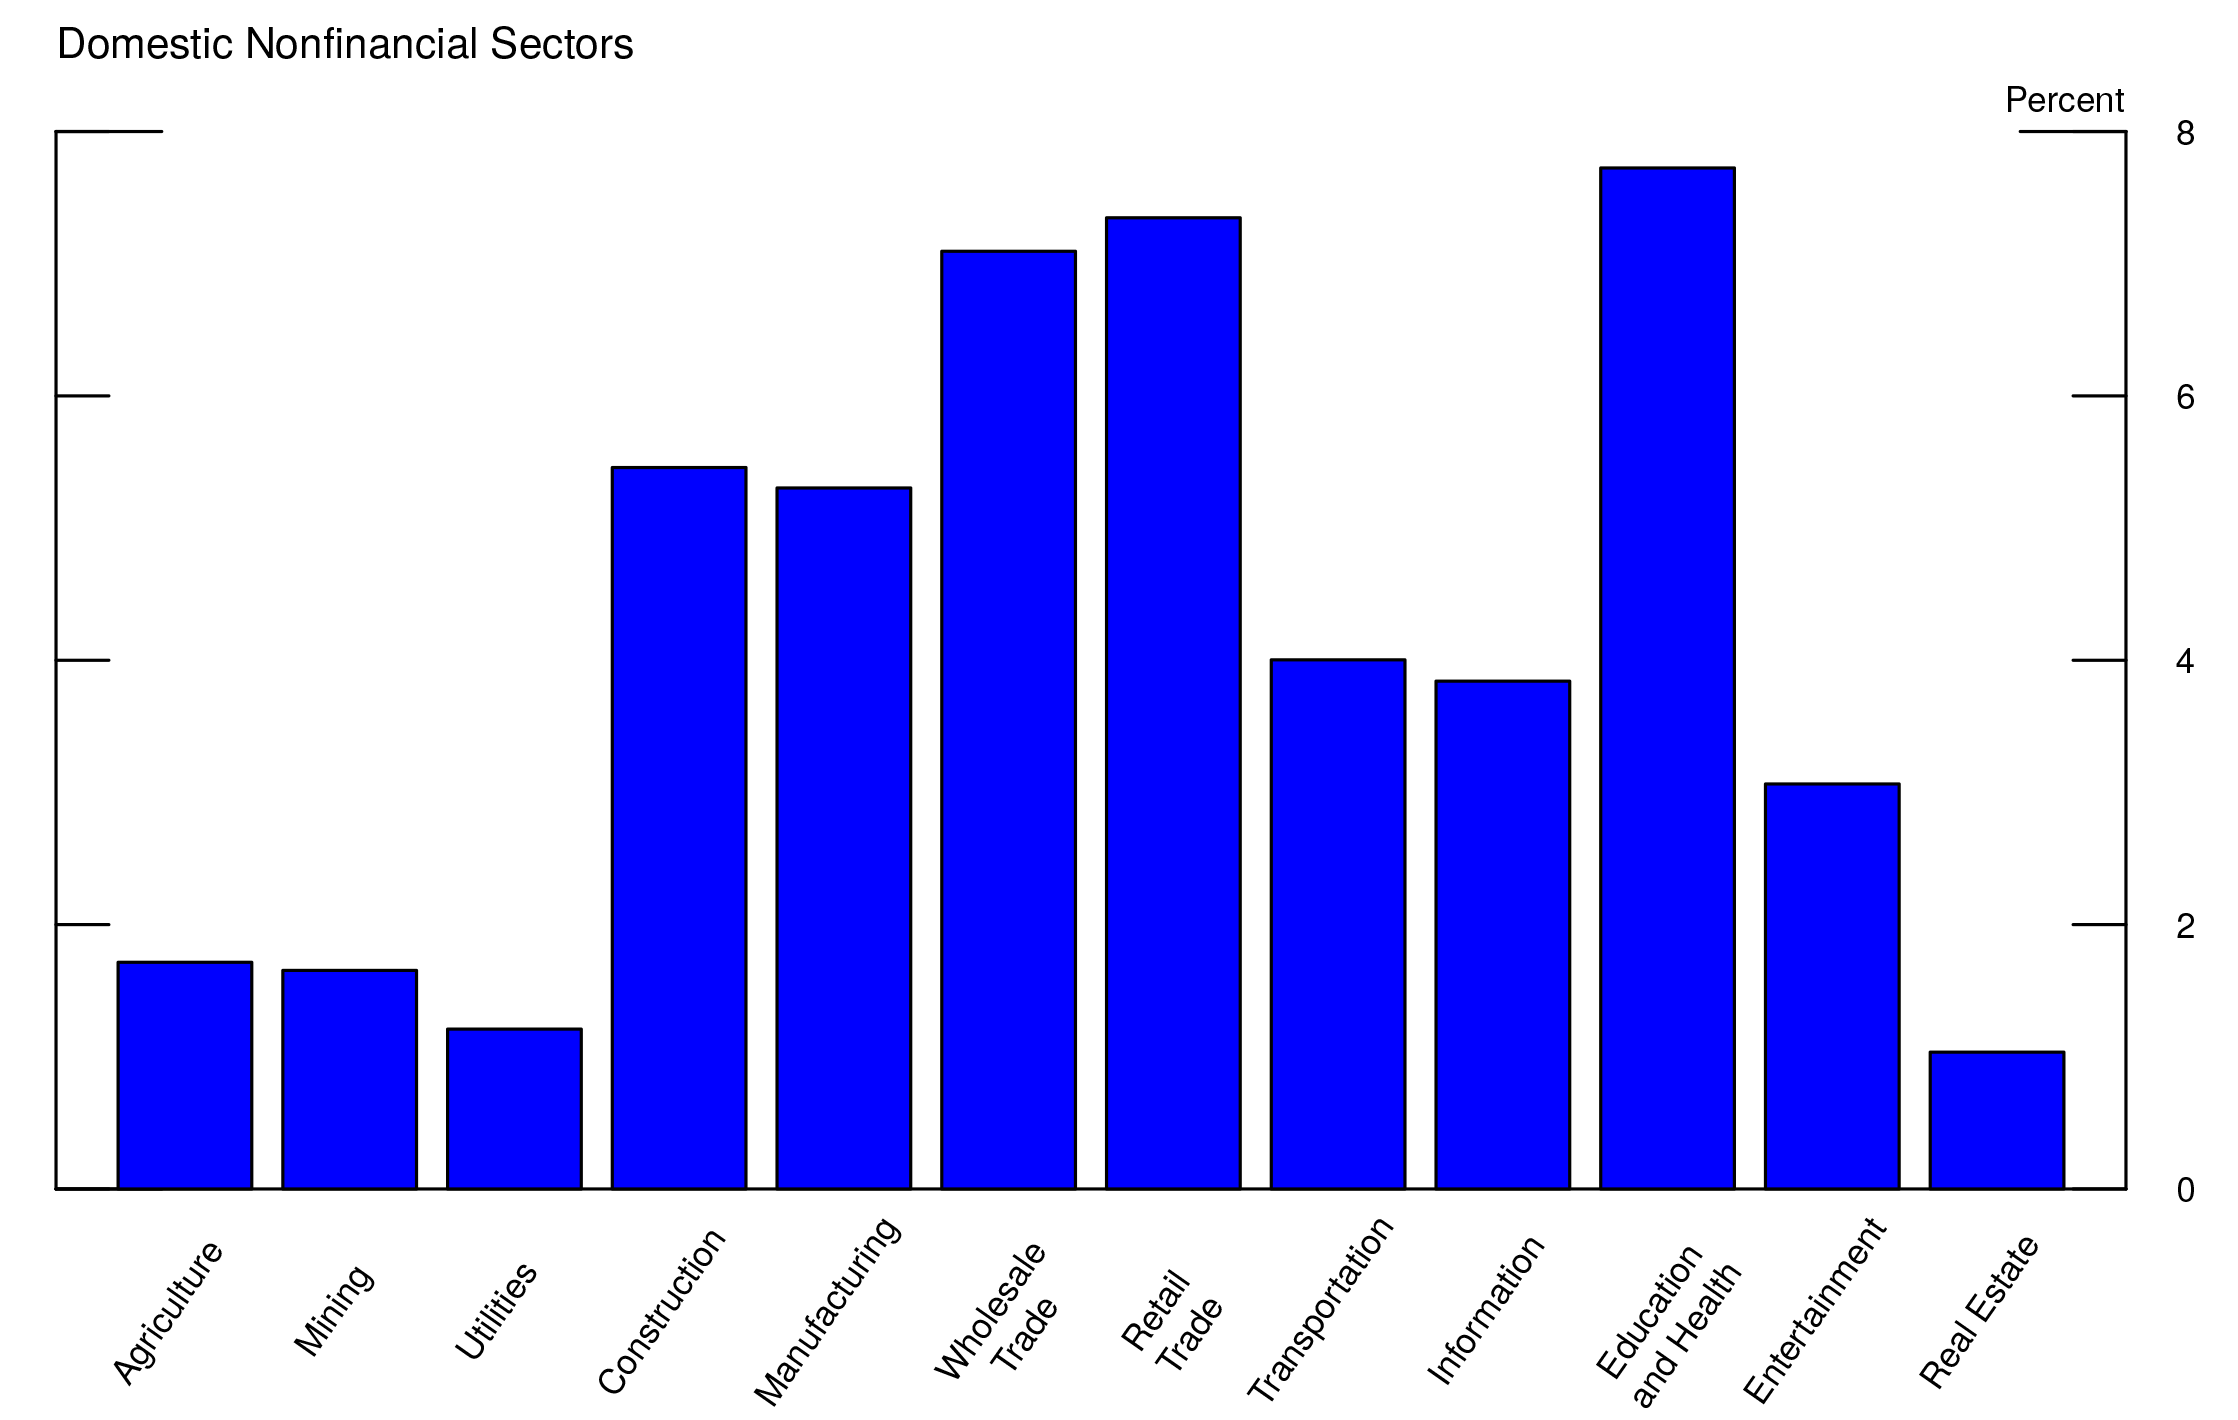
Source: Bureau of Economic Analysis. Sectors are defined by the NAICS classification.
Table 5 displays the total volume of outstanding bonds and loans as of March 2017 in each of these three sectors. While the utilities and energy sectors rely primarily on bond financing (88 percent and 90 percent of their total debt consists of bonds, respectively), about half of the outstanding debt of the real estate sector consists of loans. The loans overwhelmingly feature floating interest rates in the three sectors. An increase in the federal funds rate is thus likely to affect the interest rate expenses for a non-negligible fraction of corporate loans.
Table 5: Outstanding Corporate Loans and Bonds by Sector
| Total debt | Bonds | Loans | ||
|---|---|---|---|---|
| Fixed rate | Floating rate | |||
| Real estate | 791 | 390 (49%) | 30 (4%) | 371 (47%) |
| Utilities | 559 | 492 (88%) | 7 (1%) | 60 (11%) |
| Energy | 231 | 208 (90%) | 4 (2%) | 19 (8%) |
Note: Amounts are in USD billions. Figures in parenthesis are percentages of total amount outstanding in the sector.
Source: Y-14 Regulatory Reporting; S&P Compustat-Capital IQ; FISD.
Table 6 displays the maturity structure of the outstanding bonds and fixed-rate loans for the three sectors by year until 2019. It shows that fixed-rate loans have significantly shorter maturities than bonds across sectors.
Table 6: Maturity Structure of Outstanding Corporate Loans and Bonds
| Real Estate | Utilities | Energy | ||||
|---|---|---|---|---|---|---|
| Bonds | Fixed-rate loans | Bonds | Fixed-rate loans | Bonds | Fixed-rate loans | |
| 2017 | 7 | 21.5 | 5.9 | 11 | 6.3 | 18.2 |
| 2018 | 7.3 | 20.2 | 6.5 | 15.9 | 5.4 | 12.7 |
| 2019 | 13.3 | 17.4 | 6.2 | 12.1 | 5.8 | 30.5 |
Note: Percentage of current outstanding debt maturing each year.
Source: Y-14 Regulatory Reporting; S&P Compustat-Capital IQ; FISD.
We calculate the estimated increase in interest expenses for the three sectors following the same procedure as for the aggregate debt. Table 7 shows that, under the projected federal funds rate path, the additional interest expenses on outstanding corporate loans and bonds in 2019 are estimated to be $6.93 billion, $2.06 billion, and $894 million in the real estate, utilities, and energy sectors, respectively, which translates into 24, 8, and 6 percent increases in their respective 2019 interest expenses relative to the no-rate-change scenario.
Table 7: Estimated Additional Interest Expenses for the Real Estate, Utilities, and Energy Sectors
| Cumulative FFR change* | Bonds | Loans | Total | |||||||
|---|---|---|---|---|---|---|---|---|---|---|
| Real estate | Utilities | Energy | Real estate | Utilities | Energy | Real estate | Utilities | Energy | ||
| 2017 | 24 | 18 | 18 | 12 | 301 | 50 | 18 | 319 | 68 | 29 |
| 2018 | 94 | 308 | 316 | 168 | 2,473 | 413 | 145 | 2,781 | 729 | 313 |
| 2019 | 184 | 1,261 | 1,116 | 553 | 5,669 | 947 | 341 | 6,930 | 2,063 | 894 |
Note: Amounts are annual, in USD millions. The values are the total of interest expenses of loans and bonds.
* Cumulative change in basis points. Return to text
Source: Y-14 Regulatory Reporting; S&P Compustat-Capital IQ; FISD.
To compare the magnitude of these additional interest expenses, figure 3 plots the historical and the forecast path of the interest rate coverage ratios for the three sectors.9 Again, the benchmark scenario is the one in which there is no rate change in the federal funds rate (dashed red line) and an alternative scenario in which the federal funds rate follows the path implied by the forecast in the June SEP (dot-dashed blue line).10 As shown, an increase in the federal funds rate for the next three years is estimated to decrease the interest rate coverage ratio in the real estate and utilities sectors by 2019. The results suggest the three sectors are not equally vulnerable to an increase in interest rates. Potential vulnerabilities appear to be isolated to real estate firms, as a larger portion of their debt is floating rate. Even so, the deterioration in the coverage ratio for this sector is projected to drop just below the mean value of its historical distribution since 2000. The energy sector currently has a negative EBIT, which makes the interpretation of the interest rate coverage ratio less straightforward. However, the change in the interest rate coverage ratio from the projected rate hikes is modest, particularly relative to the larger effect caused by weak and volatile earnings in the sector.
Figure 3: Evolution of Interest Rate Coverage Ratios for the Real Estate, Utilities, and Energy Sectors
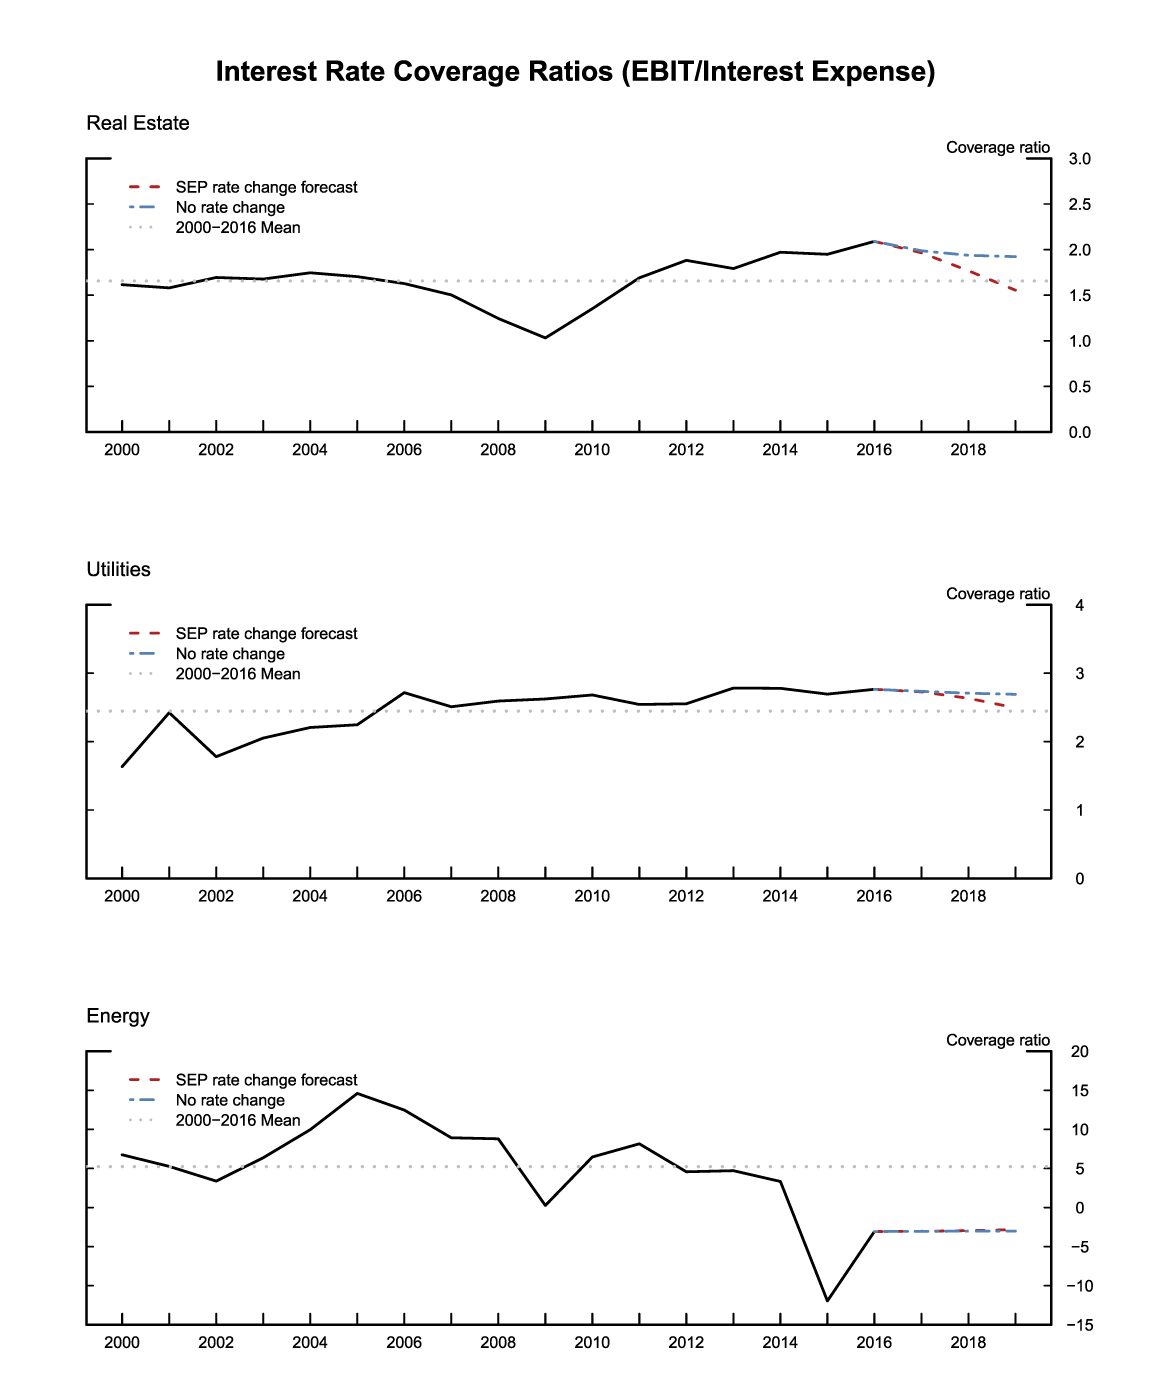
Note: Interest rate coverage ratio is measured as the ratio of the earnings before interest and taxes (EBIT) to the interest expense of each industry.
Source: Y-14 Regulatory Reporting; S&P Compustat-Capital IQ; FISD; Federal Reserve - Financial Accounts of the United States - Z.1.
Final Comments
The analysis above shows that the current expected path of the federal funds rate implies a modest deterioration in the nonfinancial corporate interest coverage ratio both at aggregate and sectoral levels. The analysis suggests limited risks in the ability of the U.S. corporate sector to cover interest payments. There are several caveats in the analysis that deserve further mention. First, it is assumed that the amount of debt outstanding and earnings remain at current levels during the forecast horizon independently of the level of the federal funds rate. This assumption does not seem ill-founded for the amount of debt outstanding in light of the well-documented evidence of sticky corporate leverage. However, earnings may be sensitive to changes in interest rates through demand and supply channels. Second, it is assumed that interest rates on corporate bonds and loans increase by the same magnitude as the federal funds rate, but a higher interest rate may further increase interest expenses if credit spreads simultaneously widen.11
References
Ippolito, Filippo, Ali K. Ozdagli, and Ander Perez-Orive (2017). "The Transmission of Monetary Policy through Bank Lending: The Floating Rate Channel," Finance and Economics Discussion Series 2017-026. Washington: Board of Governors of the Federal Reserve System, September, https://doi.org/10.17016/FEDS.2017.026.
Ogden, Rick, Francisco Palomino, Nitish Sinha, and Youngsuk Yook (2016). "Corporate Bond Issuers' Swap Exposure to Rising Interest Rates," FEDS Notes. Washington: Board of Governors of the Federal Reserve System, May 26, www.federalreserve.gov/econresdata/notes/feds-notes/2016/corporate-bond-issuers-swap-exposure-to-rising-interest-rates-20160526.html.
1. Palomino and Perez-Orive are at the Board of Governors of the Federal Reserve System. Kumbhat is a former Senior Financial Analyst in the Monetary Affairs Division at the Federal Reserve Board, and is currently a Member of the Secretariat at the G20 Financial Stability Board. The views expressed in this note are solely the responsibility of the authors and do not necessarily reflect those of the Board of Governors of the Federal Reserve System, the Financial Stability Board, or any of their staff and members. We thank Giovanni Favara and Gustavo Suarez for their helpful comments and Christopher Hollrah, Stephen Paolillo, and Yefei Wei for research assistance. Return to text
2. These estimates are based on the following assumptions: (1) loan characteristics reported by large bank holding companies in the FR Y-14 regulatory reports filings are the same as those of the universe of loans on bank holding companies' balance sheets and (2) the dollar amount and characteristics of loans that are not on banks' balance sheets are estimated using the Z.1 Financial Accounts. Return to text
3. In addition, corporations may hedge against interest rate risk fluctuations using derivative markets, which would weaken the effect of fluctuations in interest rates on interest expenses. However, it does not appear that corporations were actively engaged in interest rate hedging in recent years. According to our estimates, only about 15 percent of nonfinancial public corporations were hedging some part of their floating-rate debt in 2015. This estimate is based on a textual analysis of 10-K SEC filings by nonfinancial corporations with outstanding bank debt. Return to text
4. The exposure to floating rates can be increased by entering into interest rate swap agreements. However, the use of these instruments by corporate bond issuers seems to be very limited. See, for instance, Ogden, Palomino, Sinha, and Yook (2016). Return to text
5. Here, it is assumed that corporations maintain the same amount outstanding of bonds over time. Return to text
6. The maturity assumption ensures that debt instruments are rolled over at most once until 2019. The coupon rate assumption implies no change in the spreads of corporate debt rates to the federal funds rate. Notice that it is the coupon rate change (not the level of the coupon rate) which is important for the analysis, as it is relative to a no-change path. Return to text
7. The historical values of the nonfinancial corporate interest expenses for 2000 to 2016 are obtained by multiplying the outstanding aggregate year-end amounts of corporate bonds and loans of the nonfinancial corporate sector by their weighted average interest rates. Earnings of the nonfinancial corporate sector are obtained from NIPA tables of the BEA for 2000 to 2016. Data on corporate bond amounts and interest rates are from the Mergent Fixed Income Securities Database (FISD). Corporate bond amounts are scaled up to match the corresponding nonfinancial corporate bond levels reported in the Z.1 Flow of Funds release for each year. The outstanding corporate loan amounts are obtained from the Z.1 Flow of Funds release, and the interest rate on loans is the weighted-average effective loan rate on all C&I loans in the Survey of Terms of Business Lending--E.2 release. Return to text
8. The definitions of all sectors are based on the North American Industry Classification System (NAICS). In particular, the real estate sector consists of Real Estate (NAICS 531) and Other Financial Vehicles (NAICS 52599, which includes mortgage real estate investment trusts (REITs) and real estate mortgage investment conduits (REMICs)). The utilities sector consists of Electric Power Generation, Transmission and Distribution (NAICS 2211). Finally, the energy sector consists of Oil and Gas Extraction (NAICS 211). Interest expenses for the energy sector include mining interest expenses, as the BEA does not report separate numbers for the two sectors. Return to text
9. The historical values of the interest rate coverage ratio for the 2000–2016 period are obtained by aggregating EBIT and interest expense at the industry level on an annual basis. Firm-level observations in which either EBIT or interest expense are missing are discarded for consistency. Return to text
10. The forecast of interest rate coverage ratios under the rate change scenario, involves several steps. First, Capital IQ is used to calculate the share of total debt in each of the three sectors that consists of bonds or loans. Second, the share of loans in each of the three sectors that have fixed rates or floating rates comes from Y-14 data. Third, these shares are applied to the aggregate sector debt outstanding in each of the three industries (using Compustat) to obtain the outstanding dollar volume of bonds, floating-rate loans, and fixed-rate loans at the industry level. Fourth, the monthly maturity structure in each industry of bonds and loans is inferred using, respectively, FISD data and Y-14 data and these maturity schedules are applied to the outstanding bonds and fixed-rate loan amounts. Finally, the cumulative rate changes on a monthly basis is multiplied by the entire stock of outstanding floating-rate loans and to the cumulative stock of matured fixed-rate debt (bonds and loans) to obtain the additional interest expenses. These additional interest expenses--aggregated at the annual level for 2017, 2018, and 2019--are added to the aggregate industry interest expenses for 2016. Return to text
11. For example, a higher interest expense burden could make firms more fragile and increase spreads. In unreported results, it is estimated that the correlation between changes in high-yield bond spreads and changes in a short-term T-bill rate are slightly negative and not statistically different from zero, suggesting that our assumption is reasonable. Return to text
Kumbhat, Ashish, Francisco Palomino, and Ander Perez-Orive (2017). "The Potential Increase in Corporate Debt Interest Rate Payments from Changes in the Federal Funds Rate," FEDS Notes. Washington: Board of Governors of the Federal Reserve System, November 15, 2017, https://doi.org/10.17016/2380-7172.2076.
Disclaimer: FEDS Notes are articles in which Board staff offer their own views and present analysis on a range of topics in economics and finance. These articles are shorter and less technically oriented than FEDS Working Papers and IFDP papers.