FEDS Notes
March 08, 2024
Rising Markups and Declining Business Dynamism: Evidence From the Industry Cross Section
Brian C. Albrecht and Ryan A. Decker1
In recent decades, various measures of "business dynamism"—such as new business entry rates and gross job or worker flows—have seen significant declines in the U.S. (figure 1, right panel).2 Over a similar time frame, there is evidence that an important measure of market power—the average markup—has risen significantly (figure 1, left panel; De Loecker, Eeckhout, and Unger 2020). A natural question is whether these patterns are related.
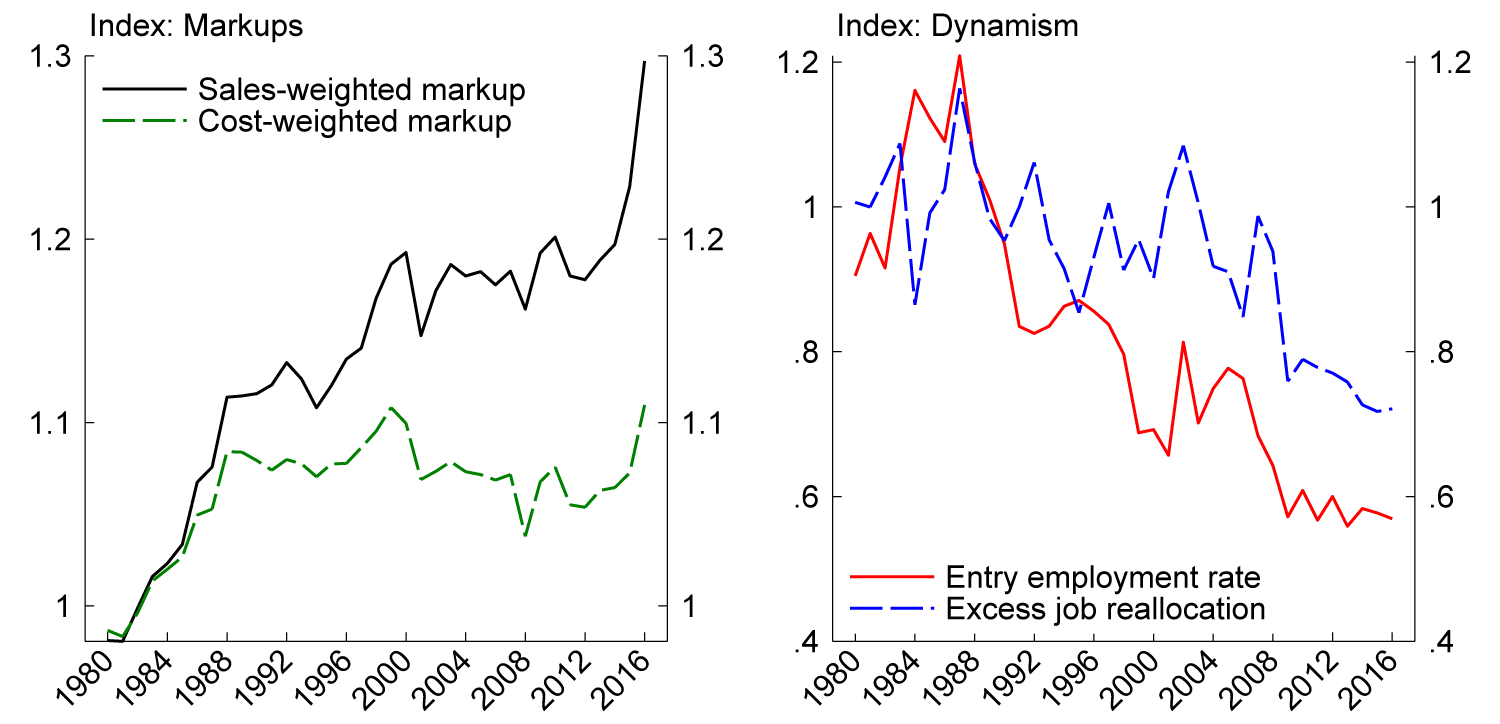
Note: Index is relative to 1980-1984 average by series. Entry rate is employment based.
Source: Business Dynamics Statistics; De Loecker, Eeckhout, & Unger (2020); and Compustat.
While the aggregate time series evidence suggests a relationship between the rise in markups and the decline in dynamism, in this note we explore cross-sectional evidence, with a focus on patterns of markup growth and dynamism decline across industries. In contrast to the aggregate patterns, looking across industries we do not find a negative correlation between changes in dynamism and changes in markups over the 1980-2016 period; and the correlation may even be positive. In other words: larger increases in markups are not associated with larger declines in dynamism at the industry level. We preview the basic pattern using broad sectors on figure 2, which plots changes in firm entry employment rates against changes in average markups on the left panel, with log changes in the right panel. Industries experiencing larger markup growth actually saw less of a decline in dynamism; we will show below that this result holds at a narrower level of industry detail as well.
In the remainder of this note, we explore these cross-sectional patterns in more detail. We then set our results in the context of the broader literature on markups and on declining dynamism then speculate on potential explanations.
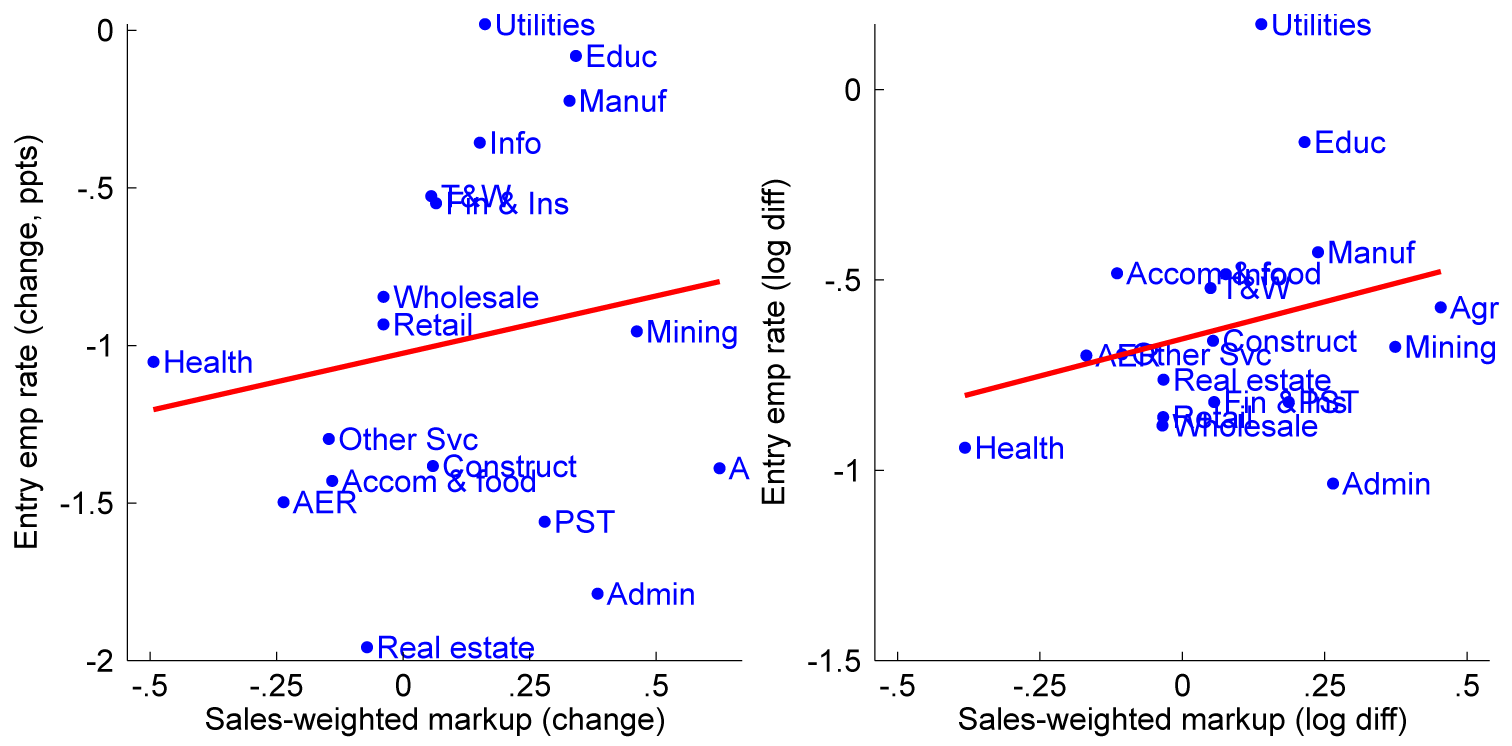
Note: Difference/log difference, 2012-2016 averave vs. 1980-1984 average. Entry rate is employment based.
Source: Business Dynamics Statistics; De Loecker, Eeckhout, & Unger (2020); and Compustat.
1. Cross-sectional evidence
1.1 Data
We obtain measures of business dynamism from the Census Bureau's Business Dynamics Statistics (BDS).3 We focus primarily on two common measures of business dynamics that have seen secular declines since the early 1980s. The first is the entry employment rate, a common measure of firm birth rates constructed as the share of total (private) employment accounted for by new firms (those with age 0).4 The second measure is the excess job reallocation rate—a common measure of business dynamism that tracks the flow of jobs across establishments. We use the terms "excess job reallocation" and "job reallocation" interchangeably.5 The aggregate entry employment rate and excess job reallocation rate are shown on the right panel of figure 1.
For markups, we use the widely followed estimates from De Loecker, Eeckhout, and Unger (2020) (hereafter DEU).6 The DEU approach to estimating markups comes from Hall (1988) and De Loecker and Warzynski (2012). DEU industry markups are based on firm-level data from Compustat, which includes only publicly traded firms. A large literature has grown up debating the limitations of these markup estimates.7 We abstract from such methodological and statistical issues and simply take the DEU markups as given.8 We focus mainly on markups constructed as the sales-weighted mean of firm-level markups, following DEU; in some exercises we also study cost-weighted markups following Edmond, Midrigan, and Xu (2023).
1.2 Industry correlations
Figure 1 showed a prima facie negative relationship between aggregate measures of business dynamics (entry rates and excess job reallocation) and markups, with the strong rise in markups from 1980-2016 matched by declines in entry and reallocation. It is this time series pattern that has led to research exploring a potential relationship between trends in dynamism and market power, a relationship that can be generated from theory (e.g., De Loecker, Eeckhout, and Mongey 2022).
In this section, we exploit industry-level data in search of cross-sectional patterns consistent with the theory and time series evidence. Throughout the section we focus on "long differences"—for our measures of dynamism and markups, we look at the change from the 1980-84 period (on average) to the 2012-16 period (on average); we take averages for the beginning and end periods to abstract from annual fluctuations. If changes in markups (or in the underlying market structure causing changes in markups) are an important explanatory factor for declining business dynamism between these time periods, we should expect industries with larger increases in markups to also exhibit larger declines in dynamism.
Figure 3 shows the relationship between the change in markups and the change in dynamism measures at the broad sector level. The left panels relate the entry employment rate with markups, while the right panels relate excess reallocation with markups. The top panels measure industry-level markups using sales weights, while the bottom panels use cost weights (the top left panel is repeated from figure 2). The solid lines show simple regression fit; given the theoretical and aggregate empirical considerations discussed above, we might expect these lines to have negative slope.
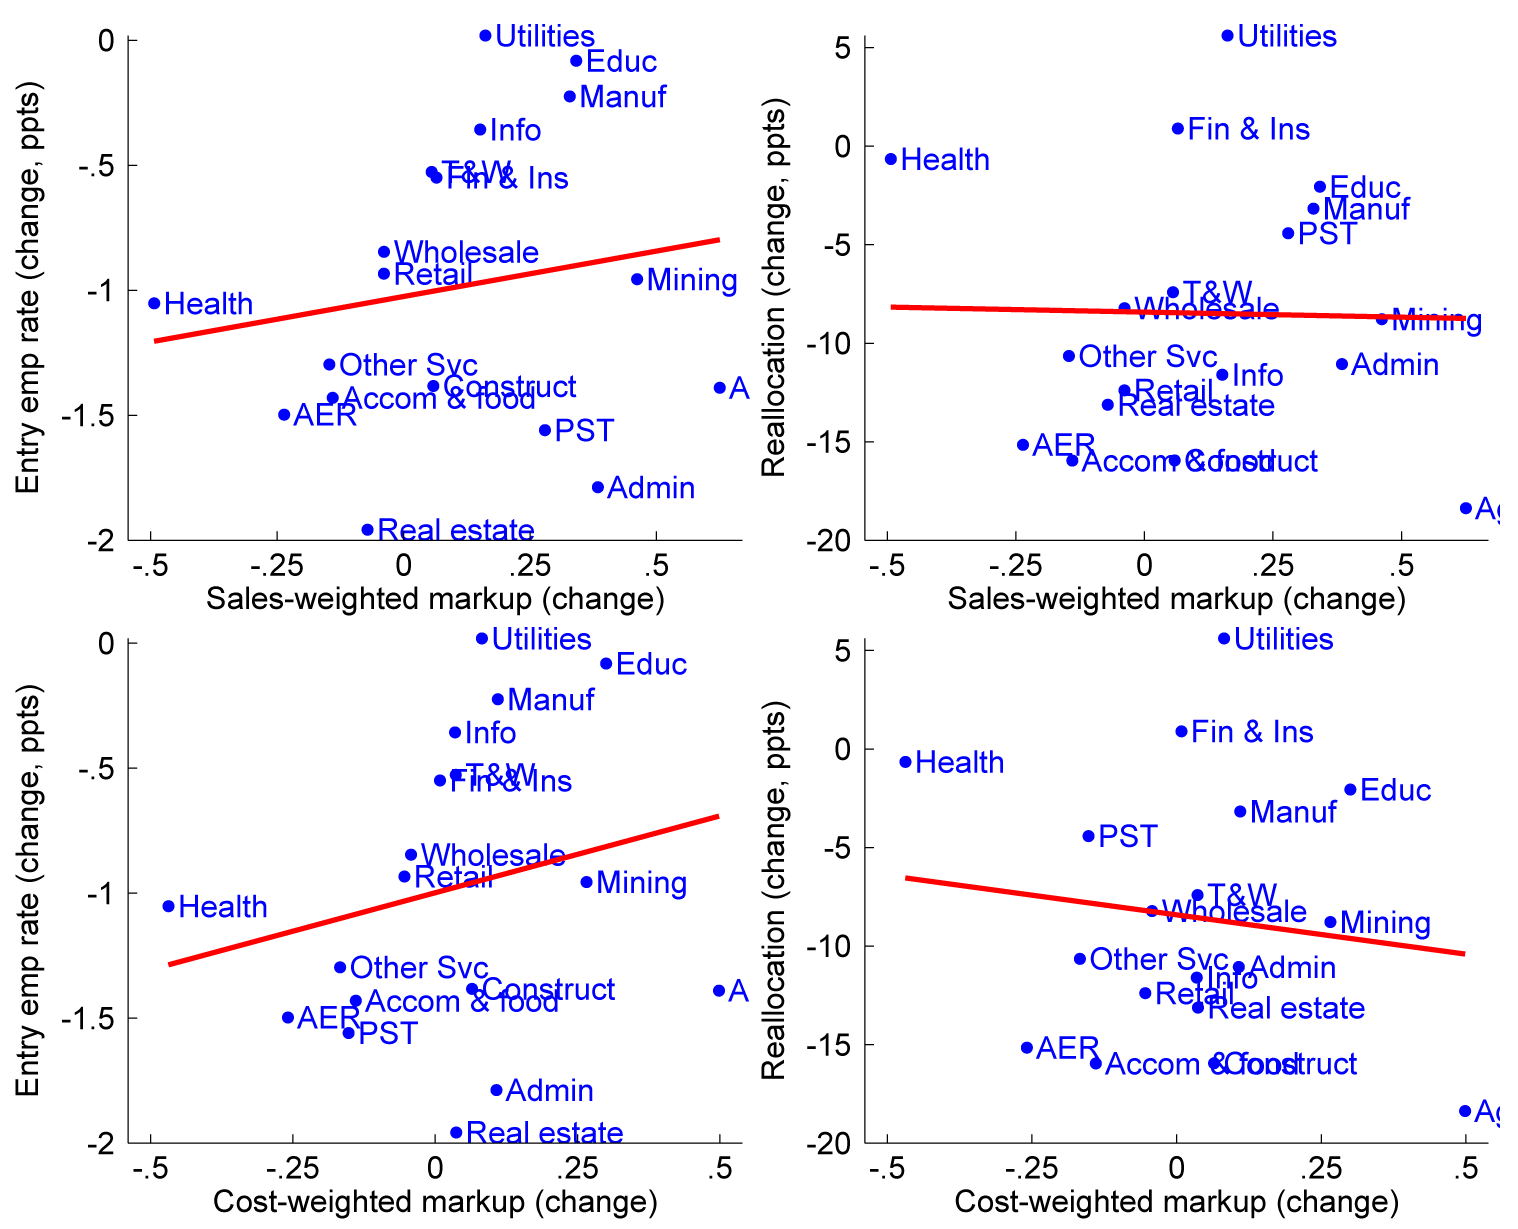
Note: Difference, 2012-2016 average vs. 1980-1984 averave. Entry rate is employment based.
Source: Business Dynamics Statistics; De Loecker, Eeckhout, & Unger (2020); and Compustat.
We first focus on the top-left panel, which relates the change in the entry rate to the change in the sales-weighted markup. In contrast to the aggregate time series, we observe a striking positive relationship between entry and markups. Some sectors with significant declines in entry—such as arts, entertainment, and recreation (AER) or accommodation and food services—actually saw declines in markups, despite the aggregate increasing markup pattern. And some sectors with large increases in markups—such as mining or, especially, manufacturing and education—saw relatively little decline in entry rates. This relationship between entry rates and markups is broadly similar when markups are constructed with cost weights, as shown by the bottom-left panel.
The left panels of figure 3 illustrate a challenge to theories positing a negative relationship between trends in business entry and markups. Certain critical sectors where large gains in markups are evident have not seen large declines in entry. Indeed, manufacturing accounts for a disproportionate share of the increase in aggregate markups,9 but it has seen relatively little decline in entry; and the tech-intensive information sector—often a focus of public discussion about market power—has likewise seen material increases in markups alongside little decline in entry.10 The main sectors where the theory may work well, with important broader implications, are professional, scientific, and technical services (PST) and administrative and support services ("Admin" in the figure).
Turning to the right panels of figure 3, changes in excess reallocation rates exhibit a flat relationship with changes in sales-weighted markups or a modestly negative relationship with cost-weighted markups. The broad sector-level comparisons, then, leave some ambiguity about the relationship between reallocation and markups. We therefore turn to more detailed industry comparisons.
Figure 4 features scatterplots at the 3-digit industry level;11 this affords much more disaggregation than the sector-level plots of figure 3.12 At this narrower level of industry detail, we observe consistent positive correlations throughout: changes in both entry rates and excess reallocation are clearly increasing in both sales- and cost-weighted markup changes.
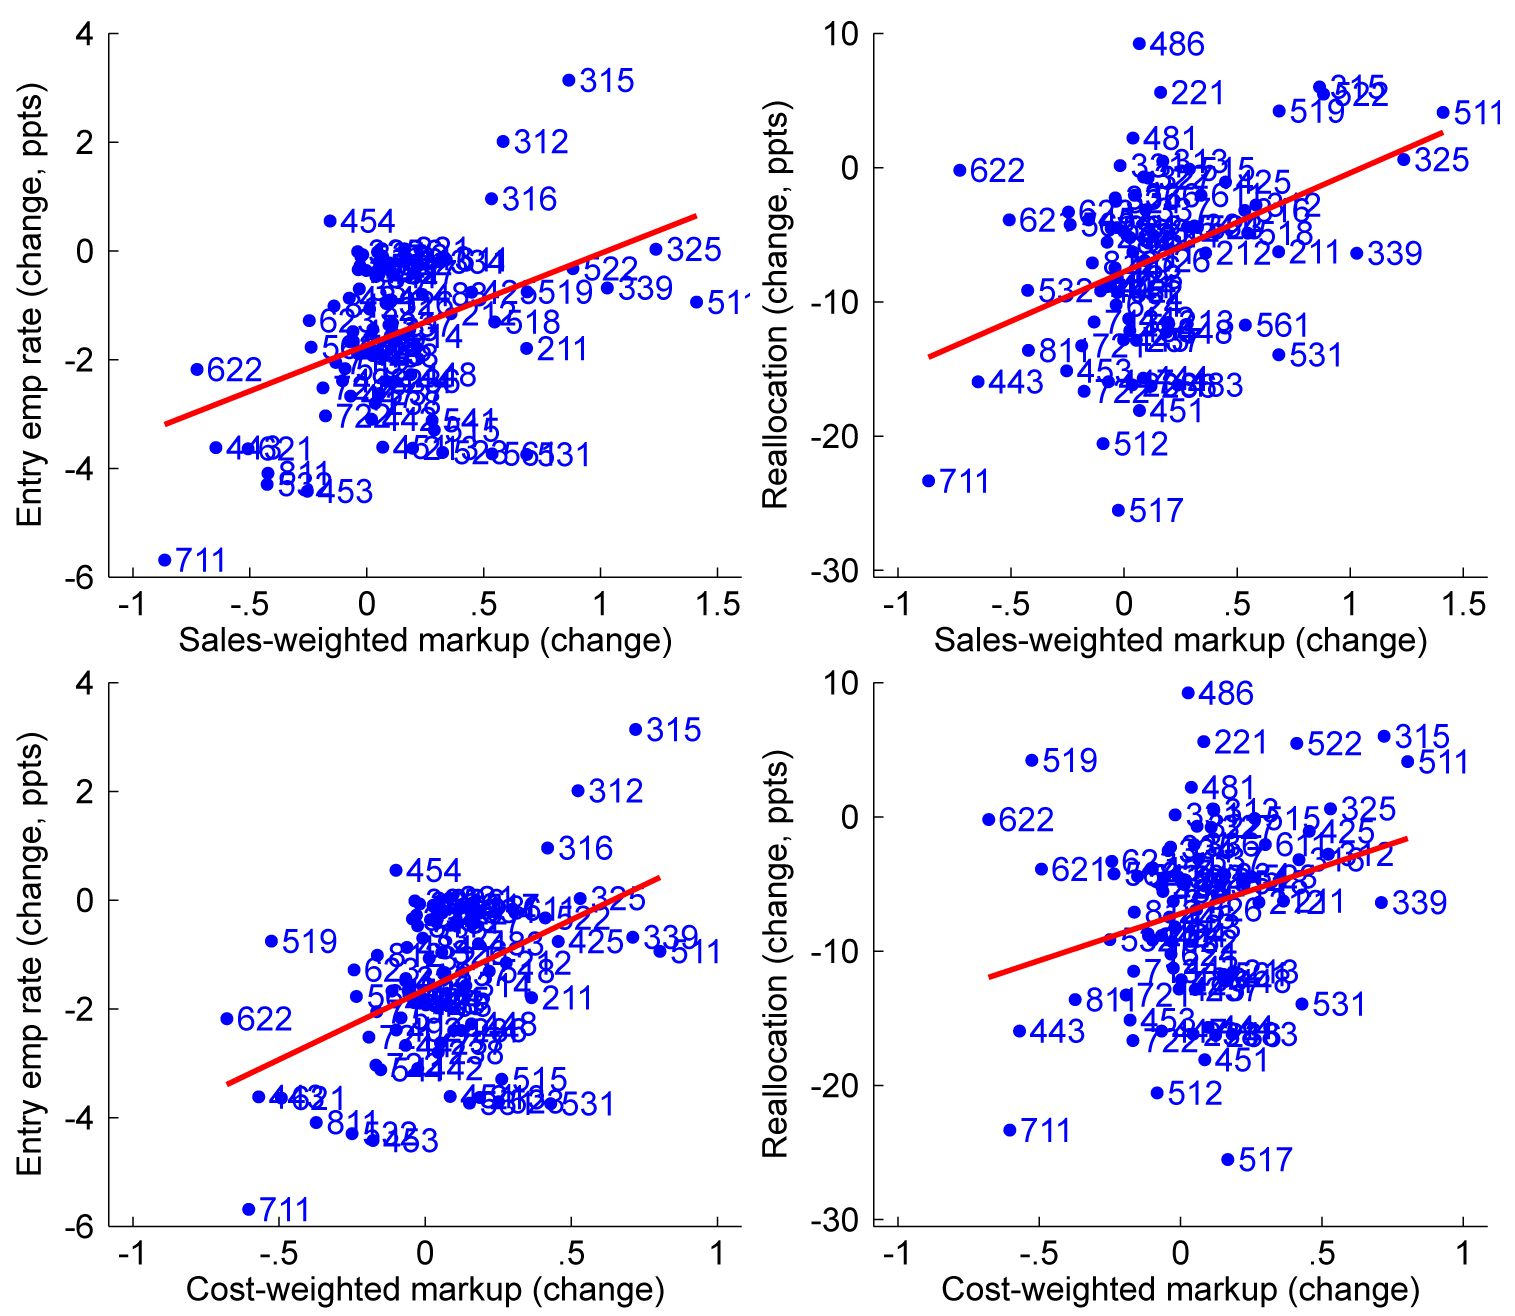
Note: Change, 2012-2016 average vs. 1980-1984 average.
Source: Business Dynamics Statistics; De Loecker, Eeckhout, & Unger (2020); and Compustat.
The differences between the correlations in figure 3 and figure 4 illustrate the importance of drilling down on cross-sectional relationships, as aggregation has large effects on dynamism versus markup patterns. In short, at this level of industry detail we find no empirical support for the theory that declining dynamism is a result of rising markups or underlying market power. Whatever causal negative effect market power (or its determinants) may have on dynamism is not evident in these simple reduced-form moments.
The cross-sectional relationships shown on figure 4 are the core of our empirical results, so we explore them in more detail with regressions reported on table 1. In the 3-digit industry data, we regress the change in dynamism measures (with specific measures indicated by column headings) on the change in markups (with markup weighting indicated on the table); these regressions correspond closely with the fit lines shown on figure 4. The top panel of table 1 reports simple unweighted regressions (i.e., each industry receives equal weight in the regression calculation), while the bottom panel reports regressions weighted by the average industry employment in 1980-1984 and 2012-2016 to capture the relative importance of large industries in accounting for aggregate patterns. While we use simple long differences on table 1, results are qualitatively similar when using log long differences.
Here we pause to emphasize some limitations of our empirical exercises. We are not uncovering causal relationships between markups and dynamism measures. Both markups and dynamism are endogenous to various other economic forces and are ultimately jointly determined. Our scatterplots and regression results are simply reduced form moments that are naturally suggested by rich models of firm dynamics like De Loecker, Eeckhout, and Mongey (2022); in a sense we are providing reduced form empirical tests of such models using cross-sectional variation.
Table 1. Dynamism vs. markups at the industry level
| (1) Entry emp | (2) Reallocation | (3) Entry emp | (4) Reallocation | |
|---|---|---|---|---|
| A. Unweighted regressions | ||||
| Markup | 1.7*** | 7.4*** | 2.6*** | 7.0* |
| (0.5) | (1.8) | (0.7) | (3.2) | |
| Constant | -1.7*** | -7.8*** | -1.6*** | -7.2*** |
| (0.2) | (0.8) | (0.2) | (0.8) | |
| Markup weighting | Sales | Sales | Cost | Cost |
| Observations | 74 | 74 | 74 | 74 |
| R2 | 0.19 | 0.17 | 0.22 | 0.08 |
| B. Employment-weighted regressions | ||||
| Markup | 0.9 | 3.4 | 2.0** | 1.8 |
| (0.6) | (3.6) | (0.8) | (5.1) | |
| Constant | -2.0*** | -8.0*** | -1.9*** | -7.8*** |
| (0.2) | (1.2) | (0.2) | (1.1) | |
| Markup weighting | Sales | Sales | Cost | Cost |
| Observations | 74 | 74 | 74 | 74 |
| R2 | 0.07 | 0.04 | 0.17 | 0.01 |
Note: t statistics in parentheses; * p < 0.05, ** p < 0.01, *** p < 0.001
Regressions of long differences (2012-16 vs. 1980-84) at 3-digit NAICS level. Weighted regressions are weighted by average employment in 1980-84 and 2012-16.
Source: Author calculations. Entry and reallocation data from Business Dynamics Statistics. Markup data from De Loecker, Eeckhout, & Unger (2020) and Compustat.
We focus first on the unweighted regressions reported on the top panel of table 1. The first column of the table reports the regression of the change in entry employment rates from 1980-84 to 2012-2016 on the change in sales-weighted markups among 3-digit industries (as in the left panels of figures 3 and 4). The coefficient is positive and highly statistically significant.13 Column 3 shows an even more positive result when markups are constructed with cost weights.
Turning to job reallocation, column 2 shows a positive, highly statistically significant relationship between changes in reallocation and changes in sales-weighted markups (as in the right panels of figures 3 and 4); the relationship is quantitatively similar, though statistically noisier, for cost-weighted markups (column 4). All measures of dynamism are positively related to markups at the 3-digit industry level, and several are statistically significantly so.
The average decline in entry and reallocation is therefore captured by the constant regression terms, rather than being captured through trends in markups.
The simple regressions on the top panel of table 1 may be misleading if a small number of large industries do exhibit a negative relationship between dynamism and markups. The bottom panel of table 1 therefore reports results from regressions that are weighted by average industry employment in 1980-1984 and 2012-2016, allowing for larger industries to have more influence on the coefficient estimates.14 Indeed, the regression coefficients are generally lower in the weighted regressions than in the unweighted regressions.15 Apparently the strong positive relationship we observe among industries on average is weaker among some large industries. Importantly, though, the relationship is still typically positive such that large industries are not likely to explain the aggregate patterns.
2. Related literature
There is a large empirical literature documenting the decline in dynamism in the U.S. since the 1980s.16 Entry rates have fallen substantially, as shown in figure 1 and documented more extensively in many papers (e.g., Decker et al. 2014). Closely related has been a more recent decline of entry in the high-tech sector and lower prevalence of high-growth young firms (Decker et al. 2016; Haltiwanger, Hathaway, and Miranda 2014; Guzman and Stern 2020). The decline in entry has coincided with declining gross job reallocation and within-firm employment volatility (Davis et al. 2007; Decker et al. 2014; Decker et al. 2020), worker flows (Hyatt and Spletzer 2013; Davis and Haltiwanger 2014), and internal migration (Molloy et al. 2016).
The literature has not found one overriding cause to explain all the key dimensions of declining dynamism, though several theories have found empirical support for some aspects of the decline including slowing labor force or population growth, changing business models in sectors like retail trade, rising importance of intangible capital, slowed diffusion of ideas, and others. None of these explanations need fully explain the decline in dynamism, and each likely plays some role.
A role for rising market power has been speculated upon many times in the dynamism and related literature. Decker et al. (2020) speculatively suggest the possibility that rising market power is related with declining dynamism based in part on simple model intuition: rising market power is often modeled as increasing curvature of revenue functions, which reduces firm- or establishment-level shock responsiveness and, therefore, aggregate job reallocation. De Loecker, Eeckhout, and Unger (2020) also propose rising market power as a likely explanation for declining dynamism, but thoroughly exploring the idea is beyond the scope of that paper. Akcigit and Ates (2023) cite rising markups alongside declining dynamism as trends to be jointly explained.
Most relevant is De Loecker, Eeckhout, and Mongey (2022), which notes the aggregate time series relationship and builds a rich model of market power, business dynamics, and entry; once calibrated and simulated, the model can more than explain the full decline in aggregate job reallocation in the U.S. using change in market structure (modeled as a decline in the number of potential entrants). But our empirical results for the cross section suggest that more work is needed to understand this relationship; in particular, we are not aware of research proposing a theoretical framework that can reconcile the well-known time series patterns with the cross-sectional patterns we document here.
3. Conclusion
This note adds to the empirical literature on trends in markups and business dynamism by exploiting cross-sectional variation.
The industry-level evidence does not support the notion that the aggregate time series for markups and business dynamism are causally related. In fact, if anything, the opposite relationship is apparent in the data: from the early 1980s through the mid-2010s, industries with larger increases in markups saw a smaller decline in dynamism. In preliminary unreported exercises, we also relate markups and dynamism measures at annual frequency, finding that contemporaneous and lagged markups are typically positively associated with dynamism measures, sometimes statistically significantly so.
Our evidence strongly suggests that rising markups—as commonly measured in the literature on broadly rising market power—are not a major explanatory factor behind declining dynamism.
Why not? We can speculate on three possible explanations for our results.
First, our simple regressions may in fact be capturing the underlying reality and even be consistent with basic theory: higher markups (and likely higher profits) can actually attract more entrants with the promise of profits in excess of entry costs, and that force may offset or completely reverse the negative relationship between markups and dynamism found in certain classes of models. This might suggest that dynamism would have declined even more in the absence of rising market power. In this case, researchers seeking to explain declining dynamism should look elsewhere, and researchers quantifying the implications of rising markups should take potential positive effects on entry into account.
A second possible explanation is that the apparent empirical failure of theories proposing a negative markups/dynamism relationship might be an artifact of the dataset on which markups are measured. While our measures of dynamism include the near-universe of firms, our measure of markups from De Loecker, Eeckhout, and Unger (2020) only includes publicly traded firms—a small minority of all firms and roughly half of overall economic activity (Decker and Williams 2023). Publicly traded firms differ from private firms in many ways including dynamism patterns, and these differences are time varying (Davis et al. 2007; Decker et al. 2016; Dinlersoz et al. 2018). Additionally, disaggregating markups by industry requires reliance on sometimes small numbers of public firms on which markup measures can be estimated.
A third possibility is that our markup concept is flawed. Even if publicly traded firms were a good proxy for the broader business universe with respect to markups, our markup measure itself is the subject of numerous methodological controversies. These include debates about production function estimation and questions about the appropriateness of using cost of goods sold (from accounting statements) as a proxy for variable costs (see footnote 7). In other words, the De Loecker, Eeckhout, and Unger (2020) measure of markups might not be capturing theoretically meaningful markups or market power, and perhaps a more accurate measure would generate the negative markup/dynamism relationship proposed by other literature.
References
Akcigit, Ufuk, and Sina T. Ates. 2023. "What Happened to US Business Dynamism?" Journal of Political Economy 131, no. 8 2059-2124.
Bond, Steve, Arshia Hashemi, Greg Kaplan, and Piotr Zoch. 2021. "Some unpleasant markup arithmetic: Production function elasticities and their estimation from production data". Journal of Monetary Economics 121 (July): 1–14. https://doi.org/10.1016/j.jmoneco.2021.05.004.
Davis, Steven J., and John Haltiwanger. 2014. Labor Market Fluidity and Economic Performance. NBER Working Paper no. 20479. At https://www.nber.org/papers/w20479.
Davis, Steven J., John Haltiwanger, Ron Jarmin, and Javier Miranda. 2007. "Volatility and Dispersion in Business Growth Rates: Publicly Traded versus Privately Held Firms." Publisher: The University of Chicago Press, NBER Macroeconomics Annual 21 (January): 107–179. https://doi.org/10.1086/ma.21.25554954.
De Loecker, Jan. 2021. "Comment on (Un)pleasant. by Bond et al (2020)." Publisher: North-Holland, Journal of Monetary Economics 121 (July): 15–18. https://doi.org/10.1016/j.jmoneco.2021.04.009.
De Loecker, Jan, Jan Eeckhout, and Simon Mongey. 2022. Quantifying Market Power and Business Dynamism in the Macroeconomy. NBER Working Paper no. 28761. At http://www.nber.org/papers/w28761.
De Loecker, Jan, Jan Eeckhout, and Gabriel Unger. 2020. "The rise of market power and the macroeconomic implications." Publisher: Oxford University Press, Quarterly Journal of Economics 135, no. 2 (May): 561–644. https://academic.oup.com/qje/article/135/2/561/5714769.
De Loecker, Jan, and Frederic Warzynski. 2012. "Markups and Firm-Level Export Status." American Economic Review 102, no. 6 (October): 2437–2471. https://pubs.aeaweb.org/doi/10.1257/aer.102.6.2437.
De Ridder, Maarten, Basile Grassi, and Giovanni Morzenti. 2022. "The Hitchhiker's Guide to Markup Estimation." Working paper. Accessed February 14, 2024. At https://www.maartenderidder.com/uploads/6/2/2/3/6223410/dgm_wip_-_2022-05-14t104423.870.pdf.
Decker, Ryan, and Jacob Williams. 2023. "A note on industry concentration measurement" FEDS Notes (February). Accessed August 22, 2023. https://www.federalreserve.gov/econres/notes/feds-notes/a-note-on-industry-concentration-measurement20230203.html.
Decker, Ryan A., and John Haltiwanger. Forthcoming. "Surging business formation in the pandemic: Causes and consequences." Brookings Papers on Economic Activity, Fall 2023. At https://www.brookings.edu/wp-content/uploads/2023/09/4_Decker-Haltiwanger_unembargoed.pdf
Decker, Ryan A., John C. Haltiwanger, Ron S. Jarmin, and Javier Miranda. 2014. "The Role of Entrepreneurship in US Job Creation and Economic Dynamism." Journal of Economic Perspectives 28 (3): 3–24. https://doi.org/10.1257/jep.28.3.3. http://dx.doi.org/10.1257/jep.28.3.3.
Decker, Ryan A., John Haltiwanger, Ron S. Jarmin, and Javier Miranda. 2016. "Where has all the skewness gone? The decline in high-growth (young) firms in the U.S." European Economic Review 86 (July):4-23.
Decker, Ryan A., John C. Haltiwanger, Ron S. Jarmin, and Javier Miranda. 2020. "Changing Business Dynamism and Productivity: Shocks versus Responsiveness." American Economic Review 110, no. 12 (December): 3952–3990. https://doi.org/10.1257/AER.20190680.
Dinlersoz, Emin, Sebnem Kalemli-Ozcan, Henry Hyatt, and Veronika Penciakova. 2018. Leverage over the Life Cycle and Implications for Firm Growth and Shock Responsiveness. NBER Working Paper no. 25226. At https://www.nber.org/papers/w25226.
Doraszelski, Ulrich, and Jordi Jaumandreu. 2019. Using Cost Minimization to Estimate Markups. Working paper. Accessed February 17, 2024. At https://faculty.wharton.upenn.edu/wp-content/uploads/2019/07/robust_markups20190625.pdf.
Doraszelski, Ulrich, and Jordi Jaumandreu. 2023. Reexamining the De Loecker and Warzynski (2012) method for estimating markups. Working paper. Accessed February 17, 2024. At https://faculty.wharton.upenn.edu/wp-content/uploads/2016/11/Doraszelski-Reexamining-the-De-Loecker-Paper-10.30.23.pdf.
Edmond, Chris, Virgiliu Midrigan, and Daniel Yi Xu. 2023. "How Costly Are Markups?" Journal of Political Economy 131 no. 7:1619-1675. https://doi.org/10.1086/722986.
Flynn, Zach, Amit Gandhi, and James Traina. 2019. Measuring Markups with Production Data. Working paper. Accessed February 17, 2024. At https://zflynn.com/papers/mpid_zfagjt.pdf.
Foster, Lucia, John C. Haltiwanger, and Cody Tuttle. 2022. "Rising Markups or Changing Technology?" NBER Working Paper no. 30491. At https://www.nber.org/papers/w30491.
Guzman, Jorge, and Scott Stern. 2020. "The State of American Entrepreneurship: New Estimates of the Quantity and Quality of Entrepreneurship for 32 US States, 1988–2014." American Economic Journal: Economic Policy 12, no. 4 (November): 212–243. https://doi.org/10.1257/pol.20170498.
Hall, Robert E. 1988. "The Relation between Price and Marginal Cost in U.S. Industry." Journal of Political Economy 96 no. 5:921-947.
Haltiwanger, John, Ian Hathaway, and Javier Miranda. 2014. "Declining business dynamism in the US high-technology sector." Ewing Marion Kauffman Foundation brief. At https://www.kauffman.org/wp-content/uploads/2019/12/declining_business_dynamism_in_us_high_tech_sector.pdf.
Hyatt, Henry R., and James R. Spletzer. 2013. "The recent decline in employment dynamics." IZA Journal of Labor Economics 2, no. 1 (September). https://doi.org/10.1186/2193-8997-2-5.
Karahan, Fatih, Benjamin Pugsley, and Aysegul Sahin. 2022. "Demographic Origins of the Startup Deficit." Working paper. Accessed February 17, 2024. At https://drive.google.com/file/d/1LlTbXXoGaf-kC7_0XWjjqFGaIy-Jp_K0/view?usp=sharing.
Kirov, Ivan, Paolo Mengano, and James Traina. 2023. "Measuring Markups with Revenue Data." Working paper. Accessed November 21, 2023. https://doi.org/10.2139/ssrn.3912966.
Kirov, Ivan, and James Traina. 2023. "Labor Market Power and Technological Change in US Manufacturing." Working paper. Accessed February 17, 2024. At https://raw.githubusercontent.com/James-Traina/Working-Papers/main/Markups-Markdowns.pdf.
Konczal, Mike, and Niko Lusiani. 2022. "Prices, Profits, and Power: An Analysis of 2021 Firm-Level Markups." Roosevelt Institute. Accessed February 17, 2024. At https://rooseveltinstitute.org/wp-content/uploads/2022/06/RI_PricesProfitsPower_202206.pdf.
Molloy, Raven, Riccardo Trezzi, Christopher L Smith, and Abigail Wozniak. 2016. "Understanding declining fluidity in the US labor market." Brookings Papers on Economic Activity 2016 (1): 183–259.
Murphy, Kevin M., and Robert H. Topel. 1985. "Estimation and Inference in Two-Step Econometric Models." Journal of Business & Economic Statistics 3 (4): 370–379. https://doi.org/10.2307/1391724.
Oxley, Les, and Michael McAleer. 1993. "Econometric Issues in Macroeconomic Models with Generated Regressors". Journal of Economic Surveys 7 (1): 1–40. https://doi.org/10.1111/j.1467-6419.1993.tb00158.x
Raval, Devesh. 2023. "Testing the Production Approach to Markup Estimation." The Review of Economic Studies 90, no. 5 (October): 2592–2611. https://doi.org/10.1093/restud/rdad002.
Traina, James. 2018. "Is Aggregate Market Power Increasing? Production Trends Using Financial Statements." https://dx.doi.org/10.2139/ssrn.3120849.
1. Albrecht: International Center for Law & Economics; email: [email protected]. Decker: Federal Reserve Board; email: [email protected]. The analysis and conclusions set forth are those of the authors and do not indicate concurrence by other members of the research staff or the Board of Governors of the Federal Reserve System. Return to text
2. In this note we focus on the decades prior to the COVID-19 pandemic. The pandemic witnessed a dramatic surge in measures of business dynamism (Decker and Haltiwanger forthcoming) and widespread controversies about the behavior of markups (a useful starting point is Konczal and Lusiani 2022). We do not address the pandemic period in the present note. Examples of literature on the pre-pandemic decline in business dynamism include Decker et al. (2014), Karahan, Pugsley, and Sahin (2022), Decker et al. (2020), and Akcigit and Ates (2023). Return to text
3. We use the BDS release vintage published in the fall of 2023. The BDS are publicly available tabulations from the confidential Longitudinal Business Database (LBD) microdata. These data are the workhorse public-use data source for studying firm dynamics and the pre-pandemic decline in business dynamism in the U.S. (see, e.g., Decker et al. 2014), covering the near-universe of private nonfarm employer establishments since the late 1970s. Return to text
4. This is sometimes called the “employment-weighted entry rate” and is defined as $$ e_t^0/(.5e_t+.5e_(t-1)) $$, where $$ e_t^0 $$ is employment among firms with age 0 (i.e., new entrants) in year $$ t $$, and $$ e_t $$ is total employment among all firms in year $$ t $$. For the denominator in the entry employment rate we use the longitudinally consistent “denom” variable in the BDS data files. Return to text
5. Gross job reallocation is constructed as $$ (jc_t+jd_t-|jc_t-jd_t |)/(.5e_t+.5e_(t-1)) $$, where $$ jc_t $$ is gross job creation by entering and expanding establishments and $$ jd_t $$ is gross job destruction among contracting and exiting establishments, and $$ |jc_t-jd_t | $$ is the absolute net employment change. For the denominator we again use the longitudinally consistent “denom” variable from the BDS. Excess job reallocation is the job reallocation occurring in excess of net employment changes and tends to move closely with the dispersion in establishment-level growth rates (Decker et al. 2016); this measure can therefore be thought of like a second moment of employment growth. Return to text
6. The De Loecker, Eeckhout, and Unger (2020) published paper comes with replication files; we directly exploit those files, running their code on Compustat data. The replication files do not include code replicating the paper's revenue function estimation but instead provide revenue elasticities necessary for markup construction. As a result, we limit our time sample to the period covered by the replication files (i.e., through 2016), and we start in 1980 (rather than earlier) consistent with much of the declining dynamism literature. Return to text
7. The DEU markup concept arises from cost minimization and implies that the markup is equal to the ratio of sales to expenditures on any fully variable input, multiplied by the output elasticity of that input. DEU use the accounting object cost of goods sold (COGS) as a proxy for expenditures on a variable input, under the assumption that COGS corresponds to variable input expenditures; and they estimate firm-level revenue functions to obtain revenue elasticities, which they use as proxies for output elasticities. Raval (2023) finds evidence in several datasets that labor and materials (both of which can appear in COGS) result in different markup estimates when used independently, casting doubt on the notion that COGS is a clean measure of variable input expenditures. COGS may include some non-variable inputs, which would violate the assumptions under which this markup concept is valid. For different reasons, Traina (2018) argues for using COGS plus selling, general, and administrative expenses (SGA). Foster, Haltiwanger, and Tuttle (2022) argue for using materials costs in markup estimation and find—when estimating output elasticities at a narrower level of industry detail than DEU—that accounting for technology investment results in smaller markup increases than DEU. There is also a large econometric debate about possible issues with the DEU approach to estimating production functions (necessary for obtaining output elasticity estimates) and associated markups. See Flynn, Gandhi, and Traina (2019), Kirov and Traina (2023), Kirov, Mengano, and Traina (2023), Bond et al. (2021), Doraszelski and Jaumandreu (2019, 2023), De Loecker (2021), and De Ridder, Grassi, and Morzenti (2022). In addition to limitations associated with production function estimation issues, these estimates rely on Compustat data covering only publicly traded firms. The firms in Compustat account for roughly half of aggregate private sales, and this share varies widely across narrow industries (Decker and Williams 2023); the literature has found that patterns of business dynamism differ between publicly traded and privately held firms (Davis et al. 2007; Decker et al. 2016). There are also questions about scope and industry classification issues in Compustat sales data (see Decker and Williams 2023 and citations therein). Return to text
8. This also means that we do not address the concern of imputed regressors (Murphy and Topel 1985; Oxley and McAleer 1993), so our standard errors are likely understated. Return to text
9. Manufacturing accounts for more than one-third of the rise in the aggregate sales-weighted markup over the period we study. Return to text
10. Importantly, the information sector exhibits significant time series heterogeneity over this time period, with flat or even rising entry into the 1990s followed by a decline in the 2000s; see Decker et al. (2016). Return to text
11. NAICS industry codes do not have a consistent vintage in the Compustat data; where possible (i.e., when a one-to-one or many-to-one mapping exists in Census Bureau concordances), prior to merging Compustat with the BDS we convert Compustat NAICS codes to the NAICS 2017 scheme to be consistent with BDS data. The merged file lacks data for at least one of the data sources for a set of NAICS codes: NAICS 111, 112, and 482 are out of scope in the BDS (but present in Compustat); NAICS 233, 234, 235, 421, 422, and 513 appear in Compustat but are not part of the NAICS 2017 scheme so are not in the BDS; NAICS 113, 485, and 551 do not have observations in the Compustat sample. Additionally, we drop NAICS 525 (funds, trusts, and other financial vehicles) and 533 (lessors of nonfinancial intangible assets), which are extreme outliers for both entry and markups; retaining these industries does not materially change our results. Return to text
12. While Compustat data allow for up to 6-digit industry detail, we judge the 3-digit level to be as far as is practical given the general sparsity of Compustat data. Among 3-digit industries included in our analysis, the median industry-year observation during 1980-2016 has 32 firms, while the 25th percentile observation has 15 firms and the 10th percentile observation has just 6 firms. Return to text
13. In unreported exercises we find similar, though not statistically significant, results using the simple firm entry rate (i.e., new firms as a share of all firms) in unweighted regressions. Return to text
14. It might be preferable to weight these regressions by industry revenue or costs rather than employment. However, industry revenue and cost data would be difficult to construct, since Compustat data on these variables are far from representative and official, more representative data on these variables would require industry code conversions. Employment data are readily available from the BDS with consistent industry codes. Return to text
15. In unreported results, we do find some negative coefficients using the simple firm entry rate (i.e., new firms as a share of all firms) in weighted regressions, though the coefficients are not statistically significant. We find no negative coefficients when we use log long differences instead of differences in levels. Return to text
16. Most of this literature pedates the recent pandemic; Decker and Haltiwanger (forthcoming) describe and analyze elevated dynamism during the pandemic, though it is unclear whether this marks a durable reversal of the longer-run trend. Return to text
Albrecht, Brian C., and Ryan A. Decker (2024). "Rising Markups and Declining Business Dynamism: Evidence From the Industry Cross Section," FEDS Notes. Washington: Board of Governors of the Federal Reserve System, March, 08, 2024, https://doi.org/10.17016/2380-7172.3471.
Disclaimer: FEDS Notes are articles in which Board staff offer their own views and present analysis on a range of topics in economics and finance. These articles are shorter and less technically oriented than FEDS Working Papers and IFDP papers.