FEDS Notes
March 19, 2021
The Effect of Mortgage Forbearance on House Prices During COVID-19
Elliot Anenberg and Tess Scharlemann
Introduction
The contrast between the labor market and house prices during the pandemic has been stark. While the unemployment rate spiked to record highs and remains well above pre-pandemic levels, monthly house price growth has increased to an average annual rate of 10 percent, pushing house prices further above their already high levels relative to housing rents. Figure 1 shows that high unemployment typically exerts downward pressure on house prices. Panel (a) shows that a national price-to-rent ratio has been negatively correlated with the unemployment rate between 1978 - 2019. Panel (b) shows that the negative relationship between county-level house price growth and the county-level change in unemployment rate has been far weaker during the COVID-19 pandemic compared to during the Great Recession.
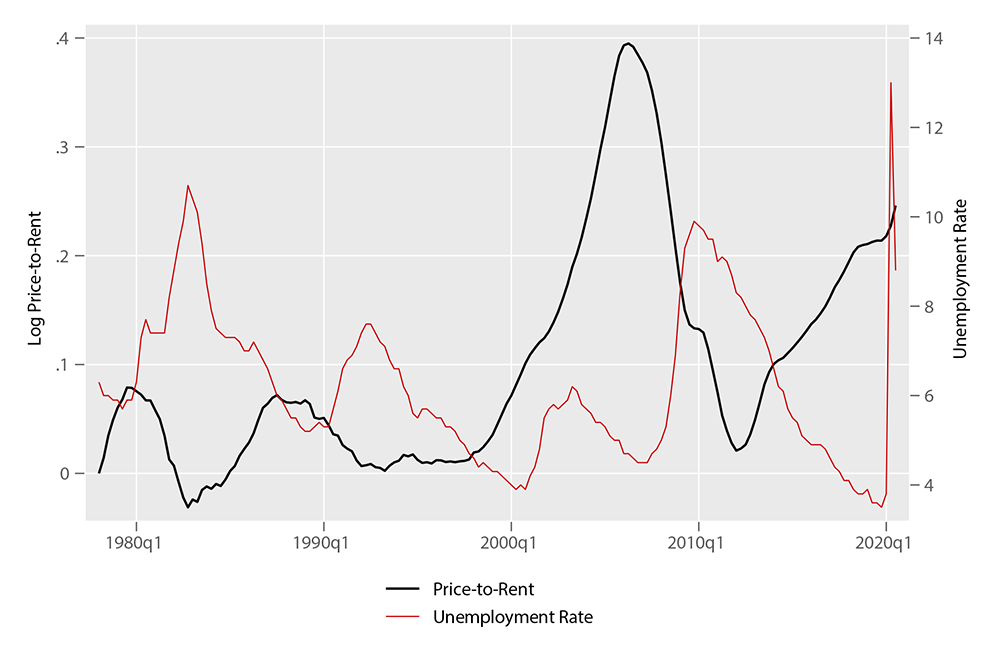
Note: National house price is from Zillow from 1996-present, and is from authors’ calculations using county-level Corelogic price indices from 1978-1995. Rent is BLS tenant rent from 1978 - 1982, and BLS OER rent thereafter.
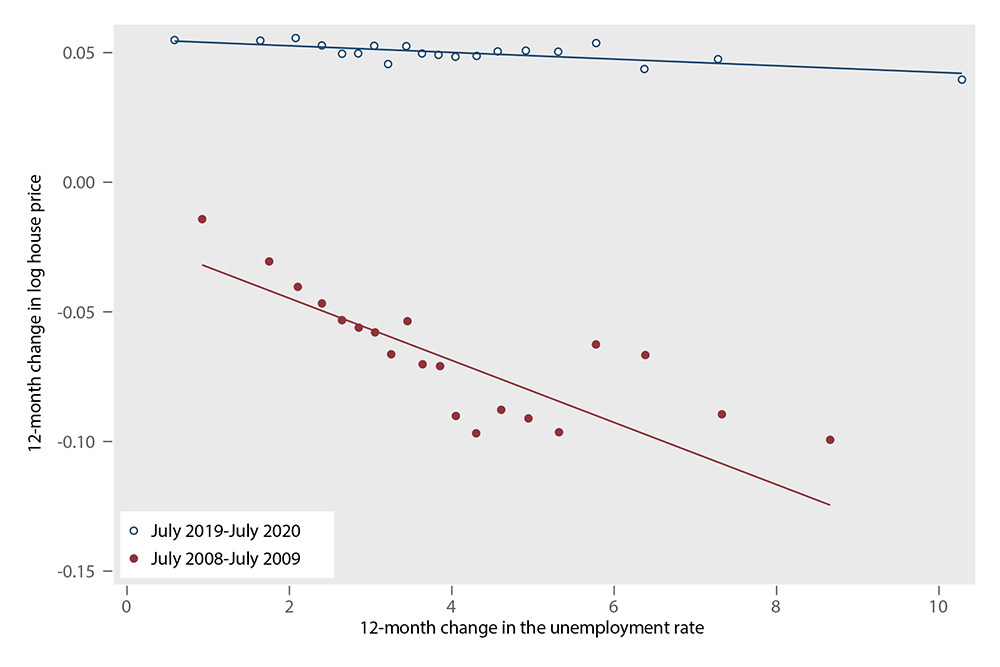
Note: Binscatter of change in log house prices and the unemployment rate, both measured at the county level.
One factor contributing to the unusual strength in house prices amid elevated unemployment could be the widespread availability of mortgage forbearance. When mortgage assistance like forbearance is unavailable, households experiencing unemployment — or landlords with tenants experiencing unemployment — may need to sell their house or face foreclosure if they cannot make their mortgage payment. These forced sales increase the supply of homes available for sale and may lower house prices. But forbearance allows liquidity-constrained households to defer mortgage payments and remain in their homes, potentially preventing a rise in unemployment from driving an increase in housing supply.1 Forbearance may have contributed to house price growth by limiting the effect of labor market weakness on for-sale housing supply.
In this note, we document a strong positive relationship between forbearance takeup and house price growth at the county level, controlling for the unemployment rate and other factors. We find that, on average, the availability of forbearance during the pandemic increased house price growth by 0.6 percentage points between April and August 2020 relative to the same four-month period in 2019. This is a large effect, as house price growth increased on average about 1 percentage point over that period. Moreover, we show that forbearance take-up is positively correlated with unemployment and negatively correlated with new home listings, suggesting that forbearance supports house prices partly through restricting new listings by borrowers experiencing negative labor market shocks.
It is worth noting that while mortgage forbearance appears to have materially supported house price growth during the early months of the pandemic, when both forbearance takeup and flows into unemployment peaked, it does not explain why house prices accelerated over the past year. A complete accounting of the drivers of house price acceleration over the course of the pandemic is beyond the scope of this note.
Mortgage Forbearance During COVID-19
Under normal circumstances, mortgage borrowers with equity are not easily able to access forbearance or other mortgage relief that would allow them to avoid a home sale if they are unable to make their mortgage payment. However, during the COVID-19 crisis, mortgage payment relief for borrowers with government-backed mortgages has been widely available and, in theory, easily accessible. Under the provisions of the CARES Act, borrowers with a pandemic-related financial hardship and a mortgage from Fannie Mae, Freddie Mac, or government agencies such as FHA are entitled to up to 12 months of forbearance, which means that borrowers can defer their mortgage payments for up to a year.2 Borrowers are not required to provide documentation of hardship to qualify for mortgage forbearance. The terms of the forbearance programs are generous. Borrowers who were current before entering forbearance are reported current to credit agencies, even if they miss payments. Under GSE and FHA guidelines, most borrowers in forbearance plans will resume their pre-forbearance principal and interest payments once their plan ends. Any missed payments will be due when they sell or refinance the loan but will not accumulate interest in the meantime. Borrowers eligible for CARES Act forbearance plans comprise about 70% of outstanding mortgage loans. Additionally, mortgage borrowers who are ineligible for CARES Act forbearance because their loans are held by banks or privately securitized were entering forbearance at much higher rates than usual, though the repayment terms on these forbearance plans are reportedly much more stringent.
The share of mortgages in forbearance peaked between May and July of 2020, and has declined a bit since then. Table 1 shows that the average share of mortgages in forbearance between May and July of 2020 across counties increased by 4.7 percentage points relative to just before the pandemic. There is substantial variation across counties. For example, 10 percent of counties experienced increases in forbearance of at least 7.8 percentage points. Table 1 also shows that new listings of homes for sale declined sharply in March through August of 2020 relative to the same period in 2019 on average.
Table 1. Summary Statistics
| Percentage Point Change in: | Mean | Std. Dev. | 10th | 50th | 90th | # Obs. |
|---|---|---|---|---|---|---|
| Forbearance | 4.69 | 2.59 | 1.91 | 4.27 | 7.83 | 1344 |
| Unemployment Rate (UR) | 6.07 | 2.78 | 3 | 5.67 | 9.4 | 1344 |
| House Price Growth | 1.08 | 2.94 | -2.22 | 1.02 | 4.53 | 1344 |
| New Listings | -8.36 | 11.8 | -21.74 | -8.98 | 6.01 | 800 |
Notes: Variables measured at the county level. House price growth is growth from March to August of 2020 less the growth from March to August of 2019. Forbearance is percent of mortgages in forbearance between May and July of 2020 less the percent of mortgages in forbearance between January and March 2020. Unemployment rate is the average unemployment rate between May and July of 2020 less the average unemployment rate between May and July of 2019. New listings is the growth in the number of new home listings during May and July 2020 relative to the same calendar months in 2019. Forbearance data is from the Federal Reserve Bank of New York Equifax Consumer Credit Panel (CCP). The CCP is derived from a nationally representative 5% anonymized random sample of adult consumers with Social Security numbers and a credit history. The unemployment rate is from the BLS. House prices are from Corelogic, Inc., Market Trends, http://www.corelogic.com/products/market-trends.aspx#container-Overview. New listings are from Redfin, a national real estate brokerage.
The unemployment rate is an important source of variation in the forbearance rate across counties. Figure 2 shows a very strong, positive and linear relationship at the county level between the 12-month increase in the unemployment rate and the share of mortgage borrowers in forbearance. Controlling for state fixed effects, increases in unemployment can explain about half of the variation in forbearance take-up across counties. Residual variation in forbearance rates across counties reflects a combination of borrower need, such as income loss, and other factors affecting forbearance takeup, such as eligibility, borrower awareness, or the ease with which mortgage servicers grant forbearance.
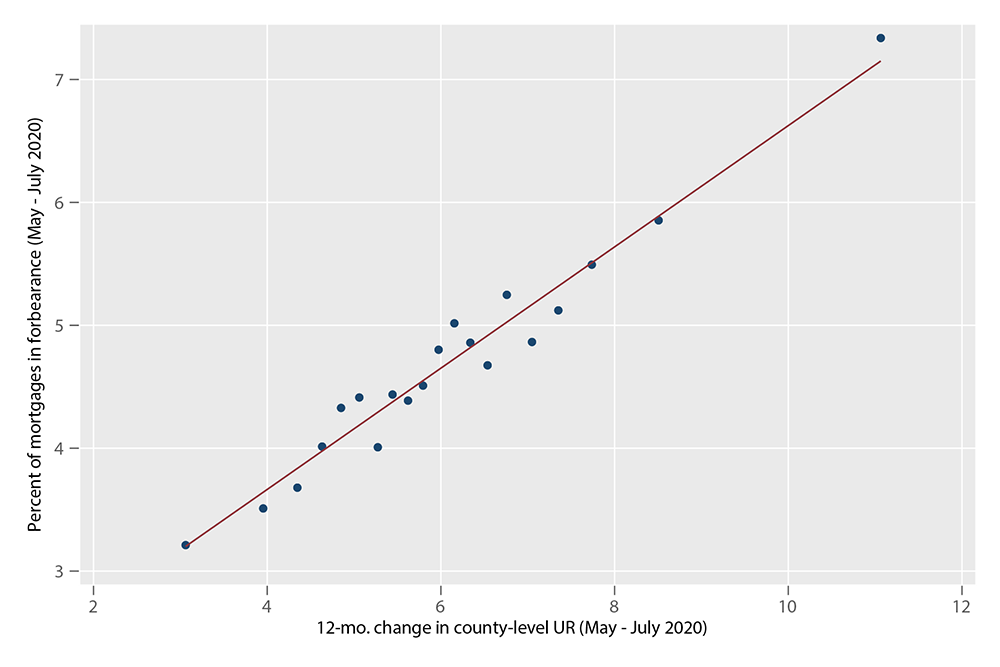
Note: Binscatter of unemployment rate and mortgage forbearance, controlling for state fixed effects. Mortgage forbearance and unemployment rate measured in percentage points. Forbearance is measured as the share of mortgages in forbearance between May and July of 2020 less the share of mortgages in forbearance between January and March 2020. Unemployment rate is measured as the average unemployment rate between May and July of 2020 less the average unemployment rate between May and July of 2019.
Effects of Forbearance on House Price Growth and Listings
To explore the correlations between house price growth, forbearance, and unemployment, we estimate the cross-sectional regression:
$$ (1) \ \ \ \ \ \ \frac{p^{Aug2020}_c}{p^{Mar2020}_c} - \frac{p^{Aug2019}_c}{p^{Mar2019}_c} = \beta_0 + \beta_1 fb_c + \beta_X X_c + \varepsilon_c $$
where $$p_c$$ is the Corelogic house price index for county $$c$$ and $$fb_c$$ is the share of mortgage loans in forbearance in county $$c$$ between May and July of 2020. Table 1 provides summary statistics for the key variables that enter equation 1.
Column 1 of Table 2 shows the estimate of $$\beta_1$$ controlling only for state fixed effects in the set of control variables, X. There is a small and statistically insignificant relationship between forbearance and the increase in house price growth between August and March 2020 relative to house price growth between August and March in 2019. When we add the year-over-year increase in the county unemployment rate as a control in column 2, the estimate of $$\beta_1$$ more than doubles. Adding the unemployment rate boosts our estimate of $$\beta_1$$ because the partial effect of the unemployment rate on house prices is negative, as shown in the table, and the unemployment rate is an important driver of forbearance takeup, as shown in Figure 2.3
Table 2. Effect of Forbearance on House Price Growth and New Listings
| (1) House Price |
(2) House Price |
(3) House Price |
(4) House Price |
(5) New Listings |
|
|---|---|---|---|---|---|
| Forbearance | 0.0337 | 0.0733* | 0.128** | -0.687** | |
| (0.0362) | (0.0424) | (0.0502) | (0.291) | ||
| UR | -0.0963* | ||||
| (0.0545) | |||||
| Forbearance*UR | 0.0165** | ||||
| (0.00737) | |||||
| State FE | X | X | X | X | X |
| State FE X UR | X | X | X | ||
| County Controls | X | X | X | ||
| R-squared | 0.0823 | 0.0851 | 0.1377 | 0.1369 | 0.3150 |
| N | 1344 | 1344 | 1344 | 1344 | 800 |
Notes: Standard errors in parentheses
* p < 0.1, ** p < 0.05, ∗∗∗ p < 0.01
See Table 1 for variable definitions and data sources. County controls include population, median income, average college share, median number of rooms for the housing stock, average time to work, and share of housing that is owner-occupied, all from the 2018 Census 5-year ACS, as well as the pre-pandemic share of mortgages that are government backed from the Equifax CCP. Standard errors clustered by state.
Our preferred specification in column 3 interacts the state-level fixed effects and average county-level pre-pandemic income with the 12-month change in the county unemployment rate. The interactions account for the possibility of substitution between forbearance and other CARES Act benefits by allowing the effect of the change in the unemployment rate to vary differentially according to the state-level maximum UI benefit and local pre-pandemic incomes (which are picked up in the fixed effects).4 We also add a number of controls for pre-pandemic county characteristics, such as average income, population, the owner-occupancy rate, and the share of mortgages that are government backed. We find that a one percentage point increase in the forbearance rate is associated with a 0.128 percentage point increase in house price growth.5 Column 4 interacts the forbearance rate with the change in the unemployment rate. The unemployment rate has a more negative effect on house price growth when the forbearance rate is low, suggesting that forbearance mitigates the negative effect of unemployment on house prices.
If forbearance supports house price growth by limiting forced selling, then we should find a negative correlation between forbearance and the number of homes being put on the market for sale. We obtain data on the number of new listings at the county level from Redfin, a national real estate brokerage. We estimate equation (1) using the specification in column 3, but we replace the dependent variable with the year-over-year increase in total new listings from May 2020 - July 2020, the period over which we measure forbearance takeup.6 Column 5 of Table 2 shows that a one percentage point increase in forbearance is associated with a 0.7 percentage point decrease in listings growth.
Discussion and Concluding Thoughts
We can use our estimates to calculate the contribution of mortgage forbearance to recent trends in house price and listings growth. Multiplying the average increase in mortgage forbearance across counties by our estimate of $$\beta_1$$ from column 3 of Table 2, we find that mortgage forbearance increased year-over-year house price growth between August and March 2020 by 0.60 percentage points. The estimate is about 14 percent of the average price growth across counties over this time period and 55 percent of the increase in price growth, as measured by our dependent variable in equation (1). A similar calculation implies that for the average county, the availability of forbearance reduced new listings growth by 3.2 percentage points, or 40% of the year-over-year decline in new listings. This finding suggests that limiting the supply of homes put on the for-sale market is an important channel through which forbearance supports house prices, though other channels may contribute as well. (For example, borrowers in forbearance may use their saved mortgage payments to maintain their spending, boosting the local economy and preventing additional unemployment.) Taken together, our findings suggest that the strong negative historical relationship between the unemployment rate and house price growth is in part driven by increases in for-sale housing supply generated by borrowers experiencing negative income shocks.
Our estimates may not reflect the causal effect of forbearance on house prices. An unobserved need for forbearance that, like the unemployment rate, is negatively related to house price growth would cause us to understate the effect of forbearance on house prices. However, it is possible that forbearance availability is negatively related to unobserved borrower need for forbearance, which could bias our point estimates upward.
Our estimates may also not reflect the causal effect of forbearance on new listings. The growth in new listings is positively correlated with the local unemployment rate, which suggests more broadly that local economic weakness may increase new listings. To the extent that unexplained variation in forbearance takeup is positively correlated with unobserved local economic weakness, we may understate the role of forbearance in limiting new listings.
Our estimates are partial equilibrium and focus on a relatively short period of time when forbearance takeup peaked, so they may not capture the long-run, general equilibrium effects of mortgage forbearance. Research on the 2008 financial crisis suggests the general equilibrium effects may be larger. During the recession following the 2008 financial crisis, forced sales in the form of foreclosures contributed significantly to widespread and large house price declines by causing price-default spirals. Foreclosures increased housing supply in areas with falling prices and weak labor markets while also preventing recently-foreclosed borrowers from re-entering the market as buyers. These factors and other foreclosure externalities combined to further lower market liquidity and prices, plunging homeowners across the country deeper into negative equity.7
Even absent foreclosures, weak labor markets may drive similar supply and demand dynamics. Like recently-foreclosed homeowners, households who recently sold a home due to liquidity constraints are unlikely to immediately re-enter the market as buyers. Thus, forbearance availability during the pandemic may have held back house price feedback loops. The combination of our results with the possibility of these price feedback loops suggest that ending forbearance programs before labor markets have recovered could decrease house price growth in some areas. More broadly, our results suggest that forbearance programs can help stabilize house prices in future economic downturns.
References
Anenberg, Elliot and Edward Kung, “Estimates of the size and source of price declines due to nearby foreclosures,” American Economic Review, 2014, 104 (8), 2527–51.
Campbell, John Y, Stefano Giglio, and Parag Pathak, “Forced sales and house prices,” American Economic Review, 2011, 101 (5), 2108–31.
Dettling, Lisa and Lauren Lambie-Hanson, “Why is the Default Rate So Low? How Economic Conditions and Public Policies Have Shaped Mortgage and Auto Delinquencies During the COVID-19 Pandemic,” FEDS Notes, forthcoming.
Favara, Giovanni and Mariassunta Giannetti, “Forced asset sales and the concentration of outstanding debt: evidence from the mortgage market,” The Journal of Finance, 2017, 72 (3), 1081–1118.
Gabriel, Stuart A, Matteo Iacoviello, and Chandler Lutz, “A crisis of missed opportunities? foreclosure costs and mortgage modification during the great recession,” Review of Financial Studies, forthcoming.
Gerardi, Kristopher, Eric Rosenblatt, Paul S Willen, and Vincent Yao, “Foreclosure externalities: New evidence,” Journal of Urban Economics, 2015, 87, 42–56.
Guren, Adam M and Timothy J McQuade, “How Do Foreclosures Exacerbate Housing Downturns?,” The Review of Economic Studies, 01 2020, 87 (3), 1331–1364.
Hsu, Joanne W, David A Matsa, and Brian T Melzer, “Unemployment insurance as a housing market stabilizer,” American Economic Review, 2018, 108 (1), 49–81.
Mian, Atif, Amir Sufi, and Francesco Trebbi, “Foreclosures, house prices, and the real economy,” The Journal of Finance, 2015, 70 (6), 2587–2634.
Molloy, Raven and Hui Shan, “The postforeclosure experience of US households,” Real Estate Economics, 2013, 41 (2), 225–254.
1. Consistent with this channel, Hsu et al. (2018) find that unemployment insurance prevented foreclosures and stabilized home prices during the Great Recession. Return to text
2. Fannie Mae, Freddie Mac, and HUD/FHA have since extended the period most borrowers are eligible to remain in forbearance to 18 months. Return to text
3. Similarly, adding forbearance as a control to a regression of house price growth on the change in unemployment makes the coefficient on unemployment more negative. Return to text
4. Dettling and Lambie-Hanson (forthcoming) offer evidence that forbearance takeup decreases in the generosity of CARES Act benefits relative to local income, controlling for the unemployment rate. Return to text
5. The county-level controls and the interaction effects each contribute to the increase in the estimated coefficient on forbearance in column 3 compared to column 2 Return to text
6. The sample size declines because Redfin does not provide listings data for all counties. Estimating the regression shown in column 3 of Table 2 using the sample of counties for which Redfin data are available, our estimate of $$\beta_1$$ increases to 0.169. Return to text
7. See Mian et al. (2015); Gabriel et al. (forthcoming); Molloy and Shan (2013); Guren and Mc- Quade (2020); Campbell et al. (2011); Favara and Giannetti (2017); Gerardi et al. (2015); Anenberg and Kung (2014). Return to text
Anenberg, Elliot, and Tess Scharlemann (2021). "The Effect of Mortgage Forbearance on House Prices During COVID-19," FEDS Notes. Washington: Board of Governors of the Federal Reserve System, March 19, 2021, https://doi.org/10.17016/2380-7172.2872.
Disclaimer: FEDS Notes are articles in which Board staff offer their own views and present analysis on a range of topics in economics and finance. These articles are shorter and less technically oriented than FEDS Working Papers and IFDP papers.