FEDS Notes
February 27, 2020
What Happened in Money Markets in September 2019?1
Sriya Anbil, Alyssa Anderson, and Zeynep Senyuz
In mid-September 2019, overnight money market rates spiked and exhibited significant volatility, amid a large drop in reserves due to the corporate tax date and increases in net Treasury issuance. Although some upward pressure on money market rates due to these seasonal factors was expected, the extent of the increase in both the level and volatility of rates in secured and unsecured markets was surprising. In this note, we review the money market events of September 2019 and discuss the factors that may have contributed to the sharp rate movements in the repo market and the associated pressures in the fed funds market.
What happened?
The moves in both secured and unsecured rates on September 16 and 17 were much larger than any of those observed over the past few years. Figure 1 shows the effective federal funds rate (EFFR) and the secured overnight financing rate (SOFR), a broad measure of the cost of borrowing cash overnight collateralized by Treasury securities, since December 2015. The EFFR has been quite stable and only printed outside the FOMC's target range on one day before September 17. While SOFR has been more volatile compared to the EFFR and exhibited some quarter-end seasonality, it rarely moves more than 20 basis points on a day.
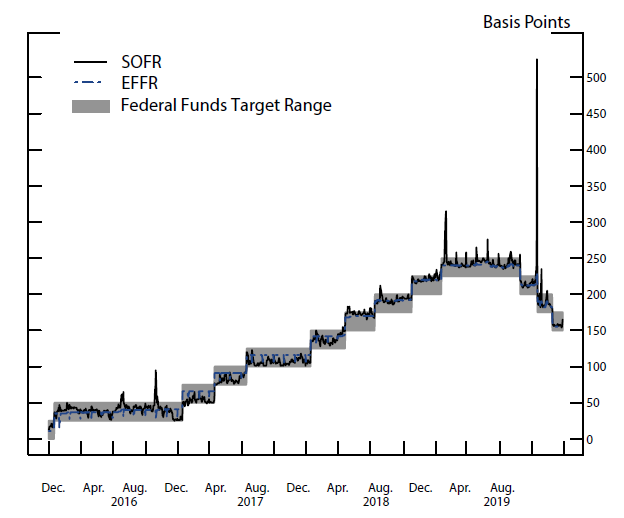
Source: Data available on FRBNY public website.
Note: Daily prints of SOFR and EFFR from December 1, 2015 to September 30, 2019.
On Monday, September 16, SOFR printed at 2.43 percent, 13 basis points higher than the previous business day. With pressures in the repo market spilling over into the fed funds market, the EFFR printed at 2.25 percent, 11 basis points above the Friday print and at the top of the FOMC's target range. On September 17, the EFFR moved above the top of the target range to 2.3 percent and the SOFR increased to above 5 percent.
Figures 2 and 3 show the shift in the distribution of trades in the repo market and the fed funds market, respectively. On September 16 and 17, the range of trades in both markets expanded significantly and rates shifted higher. Following the repo operations by the Federal Reserve Bank of New York (FRBNY), announced on September 17, the distribution of rates in both markets reverted closer to the average distributions observed over the year the next day.
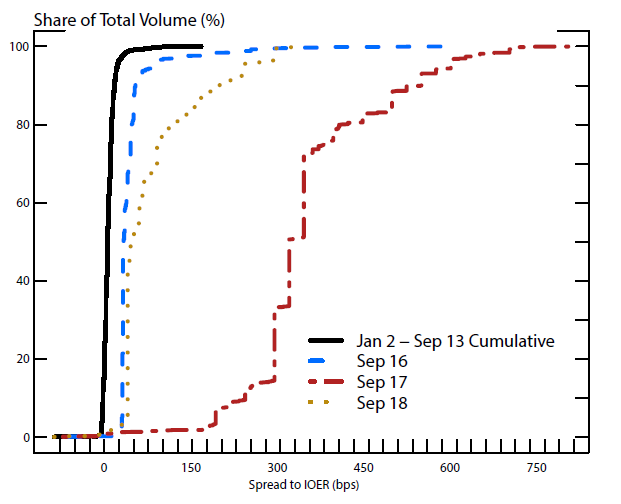
Source: FICC repo data from the Federal Reserve Bank of New York.
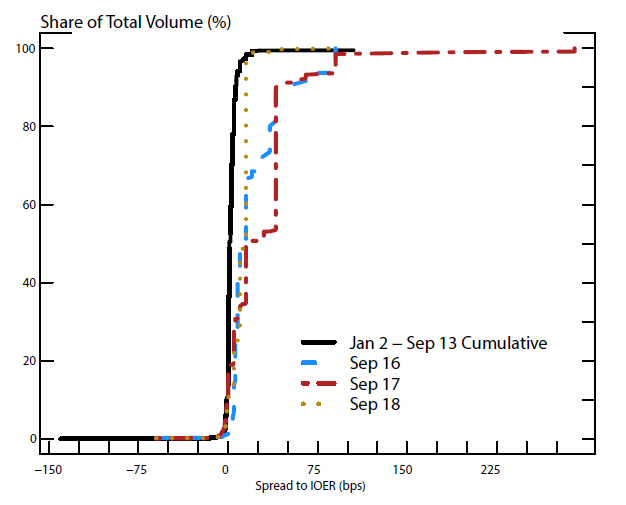
Source: FR2420 Report of Selected Money Market Rates from the Board of Governors of the Federal Reserve.
Why did this happen?
Two widely cited factors exerted upward pressure on overnight funding rates in mid-September. First, quarterly corporate tax payments that were due on September 16 were withdrawn from bank and money market mutual fund (MMF) accounts and went to the Treasury's account at the Federal Reserve (Fed). Second, $54 billion of long-term Treasury debt settled on September 16, which increased the Treasury holdings of primary dealers that purchase these securities at auctions and finance them through the repo market. As tax payments and the settlement of Treasury auctions drained a large amount of cash, reserves in the banking system declined by about $120 billion over two business days. In the repo market, there were more Treasury securities to be financed in the market that day with relatively less cash. The increase in the repo rates on September 16 seemed to stem from a demand-supply mismatch in the market.
Going into mid-September, although some upward pressure on money market rates was expected in response to tax payments and Treasury auction settlement, the realized rate movements were quite large by historical standards, as shown in Figure 1. What were the factors that exacerbated the outsized moves in money markets observed during the week of September 16?
Why were the rate moves surprisingly large?
Both broad market trends, as well as specific trading dynamics in different segments of the repo market appeared to play a role in the dynamics observed in mid-September. Below we discuss them in turn.
Broad Market Trends
Strains in money market in September occurred against a backdrop of a declining level of reserves due to the Fed's balance sheet normalization and heavy issuance of Treasury securities. Figure 4 shows the evolution of reserves and the level of Treasury securities outstanding since 2007. Following the Fed's policy response to the Global Financial Crisis and the subsequent Great Recession, reserves increased from less than $10 billion at the end of 2007 to a peak of about $2.8 trillion in October 2014. Over the following three years, reserves declined reflecting the growth in non-reserve liability items on the Fed's balance sheet, such as the U.S. Treasury, General Account (TGA), currency in circulation, and foreign official reverse repurchase agreements. In October 2017, the Fed started reducing its holdings of securities through its balance sheet normalization program, which allowed for a further gradual but steady decline in reserves. Following the conclusion of the balance sheet normalization program in August 2019, reserves continued to decline in line with the growth in the Fed's non-reserve liabilities. In addition to this gradual and predictable decline, reserves exhibit daily variability most notably due to fluctuations in the TGA. Aggregate reserves reached a multi-year low of less than $1.4 trillion in mid-September due to tax outflows and net issuance of Treasury securities, which drained more than $100 billion of reserves from the system over two days. While it is not uncommon for reserves to fall as much as $100 billion over a day or two, such a drop had not occurred at such a low level of aggregate reserves previously.
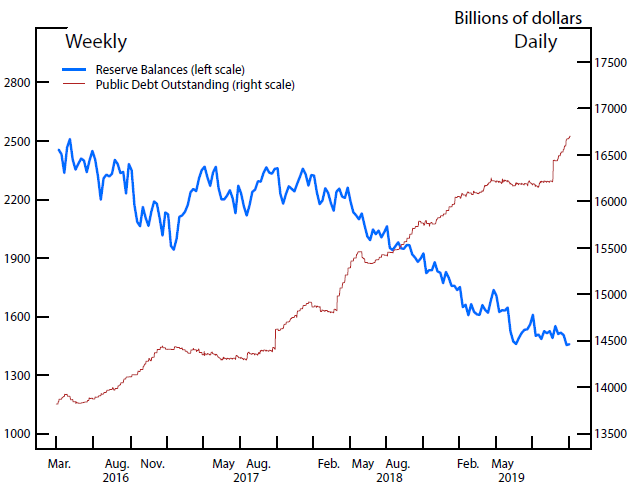
Source: Weekly snapshots of aggregate reserve balances are provided by the Federal Reserve Board's H.3 release. Public debt outstanding data are dauily and from HAVER Analytics.
While reserves were declining, total Treasury securities outstanding were increasing, as shown by the red line in Figure 4. Dealers were absorbing a substantial share of Treasury issuance, which they finance in the repo market. Figure 5 shows the net Treasury positions of primary dealers since 2015. In early 2019, net Treasury positions held by primary dealers reached an all-time high. The additional supply of Treasury securities issued in mid-September added to the already elevated inventories of primary dealers. This likely contributed to the pressures in the repo market as dealers needed to fund these securities in the repo market, leading to increased borrowing demand.
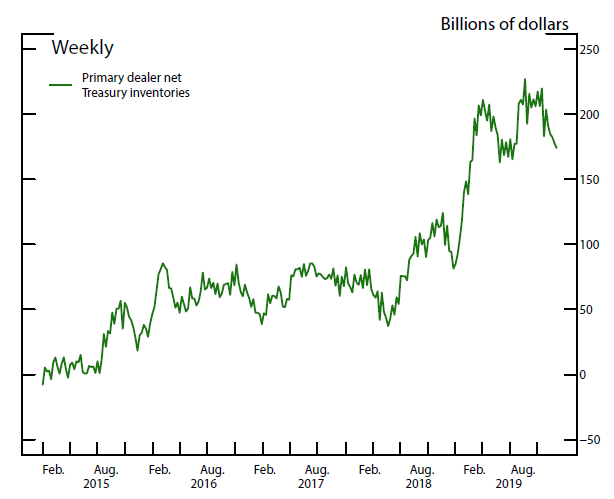
Source: Data are from the weekly release of primary dealer positions available on the public FRBNY website.
Note: Data are weekly Wednesday snapshots from January 7, 2015 to September 11, 2019.
Structure of the Repo Market
To better understand the nature of the strains that emerged in the repo market in mid-September, we need to examine trading dynamics in this highly segmented market. The Treasury repo market broadly consists of two main segments: the triparty market and the bilateral market. In the triparty market, lenders (MMFs) and borrowers (high-credit-quality dealers) use the services of Bank of New York Mellon as a custodian bank, providing operational efficiencies over the course of the transaction. In the cleared bilateral market, lenders (large dealers) and borrowers (small dealers and hedge funds) typically interact directly to agree on the terms and settle the trade. The clearing agent is the Fixed Income Credit Corporation (FICC) that stands as a central counterparty to each side of the trade. To trade in the FICC-cleared bilateral market, the entity must be a FICC member and meet certain criteria. Since 2017, overnight Treasury volumes in the triparty market averaged around $300 billion a day, while overnight Treasury volumes in the cleared bilateral market averaged around $700 billion a day.
On September 17, SOFR volume reached $1.18 trillion, an increase of $20 billion from the previous day.2 Using micro-data on the triparty segment of the repo market, we compare borrower and lender behavior in mid-September with typical dynamics in the market observed previously in 2019. In the triparty segment of the market, borrowing by dealers was stable during the week of September 16, even as rates spiked. Figures 6 and 7 show the transacted amounts and the associated rates by borrowers and lenders, respectively, on September 16 (blue dots) and on September 17 (red triangles), as well as year-to-date averages (green squares). As shown in these figures, transacted amounts by institutions were very similar on September 16 and 17 to those on normal days.
Banks, a small but growing lender in the triparty repo market, also did not increase lending over these few days.3 Increased uncertainty and the temporary nature of the rate spike likely contributed to banks' reluctance to increase their lending of excess reserves. Another reason banks may not have increased their lending may be frictions due to supervisory and regulatory factors, including firms' internal risk management practices, that may have constrained some banks from stepping in. That said, banks are relatively small lenders in the repo market. Many other institutional lenders such as MMFs and pension funds, which are not subject to these types of regulation, also appeared reluctant to increase their lending despite attractive rates in the mid-September episode.
In the FICC-cleared bilateral segment of the market, many of the larger dealers that participate are also important players in the triparty repo market. They typically borrow cash in the triparty market and lend to clients in the FICC-cleared bilateral market at a higher rate (what is referred to as "matched book activity"). The FICC-cleared bilateral segment also reportedly exhibited quite stable borrowing and lending on September 16 and 17 (not shown). Lenders did not appear to step into the market to take advantage of higher rates, perhaps given the uncertainty about their outflows and general liquidity conditions in the market.
Altogether, we document the inelastic demand of borrowers in the triparty repo market, as well as the stability of trading relationships with their lenders. Borrowers generally trade with the same group of lenders at similar volumes every day and even market volatility as substantial as what we saw in mid-September does not seem to change that.
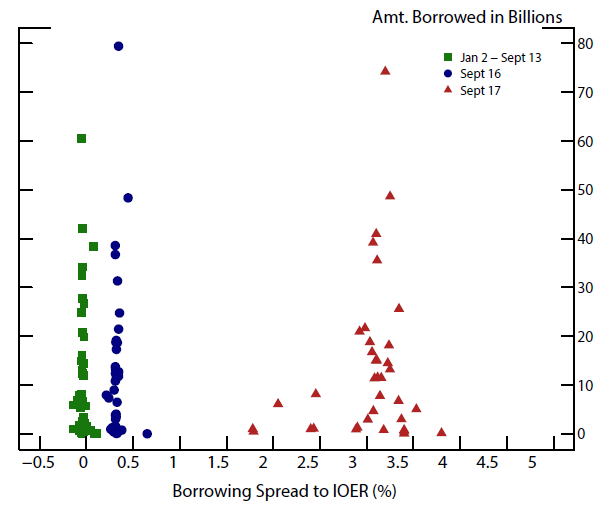
Source: FRBNY Triparty Transaction Data.
Note: Each data point represents total volume and spread of overnight triparty Treasury repo by borrower. The borrowing spread is the volumn-weighted average rate minus IOER.
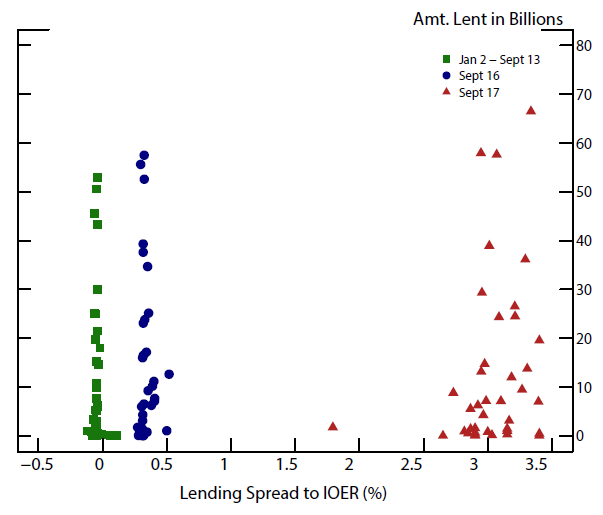
Source: FRBNY Triparty Transaction Data.
Note: Each data point represents total volume and spread of overnight triparty Treasury repo by lender. The lending spread is the volumn-weighted average rate minus IOER.
What Happened in the Fed Funds Market?
Strains in the repo market that emerged on the morning of September 16 quickly spilled over to the fed funds market later that day. On September 16 and 17, bid-ask spreads were higher than usual and the fed funds distribution became more dispersed as shown in Figure 3. On the morning of September 17, there was minimal activity in the fed funds market until after the Fed stepped into the market with repo operations, reviewed in the following section.
The fed funds market primarily consists of banks borrowing from Federal Home Loan Banks (FHLBs), rather than interbank lending. FHLBs play an important role in bank funding by providing a source of stable funding to U.S. financial institutions, mainly to support residential loan activity, through collateralized loans called advances. Additionally, FHLBs are required to hold a liquidity buffer to manage their rollover risk. Since FHLBs seek to hold this buffer in low-risk, short-term money market investments, such as fed funds and repo, they are important players in both markets.
When repo rates are higher relative to fed funds rates, FHLBs shift some of their investments from fed funds to repo to take advantage of the higher rates. Higher repo rates also increase FHLBs' bargaining power in the fed funds market, as they would be less willing to accept lower rates given their alternative investment option in the repo market. This substitution between the two markets and bargaining power of FHLBs as the primary lender of fed funds facilitate spillovers between the repo and fed funds markets.
The large drop in reserves on September 13 and 16 to $1.34 trillion, the lowest level since 2012, affected fed funds trading in mid-September. On the supply side, the lower level of reserves increased banks borrowing needs, so FHLBs, facing uncertainty regarding the liquidity needs of their member banks, reduced their fed funds lending to be able to meet potential demand for their advances. On the demand side, some banks that were not able to fulfill their reserve needs via advances wanted to borrow more in fed funds. This combination of decreased supply and increased demand resulted in elevated rates in fed funds trading on these days.
How did the Fed Respond?
In response to elevated money market rates, especially with the fed funds rate printing at the top of the target range on September 16, the Desk announced an overnight repo operation to be conducted at 9:30 AM on September 17. The operation offered up to $75 billion against Treasury, agency, and agency MBS collateral. This operation provided $53 billion in additional reserves and led to an immediate decline in rates.4 The Desk offered up to $75 billion in overnight repo each morning for the rest of that week, with all three operations fully subscribed. With subsequent announcements of further repo operations, overnight rates stabilized over the remainder of the week and EFFR returned to well within the target range.
Additionally, on September 19, the day after the FOMC meeting, the Fed implemented a 5-basis-point technical adjustment to the two administered rates: the interest rate on excess reserves (IOER) was lowered to 20 basis points below the top of the target range and the ON RRP rate was lowered to 5 basis points below the bottom of the target range. By moving IOER lower in the target range, the Fed reduced the risk of EFFR moving above the top of the range.
While overnight markets stabilized, trading volumes in term repo markets remained low, and rates were elevated and dispersed. To address potential stress around the September quarter-end, on Friday, September 20, the Desk announced a schedule of term and overnight repo operations spanning September quarter-end.
On October 11, the Fed announced two important steps to ensure that the supply of reserves remains ample at or above the level that prevailed in early September 2019. First, the Fed announced it would purchase Treasury bills at a pace of about $60 billion per month through the second quarter of 2020. Additionally, the Fed extended both its overnight and term repo operations through at least January 2020.5 These actions have been successful in stabilizing money markets, even on Treasury issuance and reporting dates when modest rate pressures are expected.
Conclusion
Strains in money markets in September seem to have originated from routine market events, including a corporate tax payment date and Treasury coupon settlement. The outsized and unexpected moves in money market rates were likely amplified by a number of factors. First, these events occurred against a backdrop of increased Treasury outstanding and reduced reserve balances. Reserves were at a multi-year low, which reduced liquidity, while Treasuries outstanding were at an all-time high, which led to increased borrowing demand. Second, borrowing demand in the repo market proved to be highly inelastic, which along with the persistence of trading relationships in the triparty segment, led cash borrowers to pay up significantly to secure the funding they needed. Lastly, on the lending side, uncertainty about cash flows and market conditions was a factor contributing to the reluctance of lenders to increase their lending in response to higher rates. For banks, this reluctance may have been exacerbated by frictions due to supervisory and regulatory factors, including their internal risk management practices, which may have prevented them from lending their excess funds to take advantage of higher rates. These factors appeared to have contributed to acute pressures on money market rates in September. Ongoing analysis may help us better understand how pressures emerged and spread across different money markets.
1. We would like to thank David Bowman, James Clouse, Caren Cox, and Chris Gust for helpful suggestions. Elizabeth Getis, Luke Morgan, and Nicole Trachman provided excellent research assistance. Return to text
2. SOFR volumes include overnight Treasury repo volumes in the triparty segment, FICC-cleared bilateral segment, and a smaller interdealer segment of the market. For more information, refer to this link: https://apps.newyorkfed.org/markets/autorates/sofr. Return to text
3. As of mid-September, banks accounted for about 5 percent of lending on average in the triparty market. Return to text
4. Since most repo trading was completed by the time of this first announcement, the first operation was not fully subscribed and average rates on September 17 were still elevated. Return to text
5. See the FOMC's announcement (https://www.federalreserve.gov/newsevents/pressreleases/monetary20191011a.htm) and the Desk's corresponding statement (https://www.newyorkfed.org/markets/opolicy/operating_policy_191011). Return to text
Anbil, Sriya, Alyssa Anderson, and Zeynep Senyuz (2020). "What Happened in Money Markets in September 2019?," FEDS Notes. Washington: Board of Governors of the Federal Reserve System, February 27, 2020, https://doi.org/10.17016/2380-7172.2527.
Disclaimer: FEDS Notes are articles in which Board staff offer their own views and present analysis on a range of topics in economics and finance. These articles are shorter and less technically oriented than FEDS Working Papers and IFDP papers.