


Employment and Job Quality
Labor market indicators remained solid despite some indications of additional challenges for workers and job seekers in 2025. There was a small increase in layoffs, slightly fewer voluntary quits, and fewer people changed jobs. More adults under age 30 also said that not being able to find work contributed to them not working.
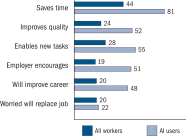
One-in-four workers had used generative AI in the prior month as a part of their job, reflecting widespread adoption of this relatively new technology. Eighty-one percent of people who had used generative AI agreed that using it saves them time, and small majorities of users also agreed that it improved quality (52 percent) and that it enables new tasks (55 percent). Users of generative AI were also more likely to agree that having it available will improve their career relative to agreeing that they worry that it will replace their jobs. Non-users were less positive, however.
Finding Work, Promotions, and Raises
Just over three-fourths of prime-age adults (ages 25 to 54) were working for pay in the month before the survey in 2025, up 1 percentage point from 2024. A smaller 71 percent of prime-age women were working for pay, reflecting the greater family and childcare responsibilities held by women (table 3, also see the "Living Arrangements and Care Work" section of this report), among other factors. Overall, not being able to find work, health limitations or disability, family and personal obligations, and childcare were the most cited reasons for not working for pay.
Table 3. Reasons for not working among prime-age adults (by demographic characteristics)
Percent
| Reason | Male | Female | Overall |
|---|---|---|---|
| Could not find work | 8 | 8 | 8 |
| Health limitations or disability | 7 | 8 | 7 |
| Family and personal obligations besides caregiving | 4 | 9 | 7 |
| Childcare | 2 | 6 | 4 |
| Caregiving for an elderly, disabled, or sick adult | 3 | 4 | 3 |
| Would lose access to government benefits | 2 | 3 | 3 |
| School or training | 1 | 1 | 1 |
| Retired | 1 | 1 | 1 |
Note: Among adults ages 25 to 54. Respondents could select multiple answers.
Despite the increase in the share of prime-age adults who were working, some people struggled to find work. Eight percent of prime-age adults said that they were not working because they were unable to find work in 2025. Seven percent said they were not working for the same reason 2024.
The job market has been challenging for young adults. Fifteen percent of adults under age 30 were not working and said that not being able to find work contributed to them not working (table 4). This was up 2 percentage points from that seen in 2024 and 5 percentage points from 2023. Over this period, the share of young adults working part time because they could not find full-time employment also increased. The 15 percent of young adults not working because of an inability to find a job in 2025 was three times that seen among adults age 30 and above.
Table 4. Difficulty finding work among young adults
Percent
| Reason | 2023 | 2024 | 2025 |
|---|---|---|---|
| Not working because could not find work | 11 | 13 | 15 |
| Working part time because could not find more work | 6 | 8 | 10 |
| Total | 17 | 20 | 25 |
Note: Among adults ages 18 to 29.
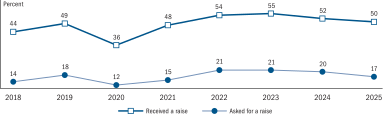
Raises and promotions also were down from levels seen during the "Great Resignation" in 2022 (figure 7). In 2025, 50 percent of workers said that they received a raise or a promotion, which was 3 percentage points lower than in 2022. Seventeen percent of workers said that they asked for a raise or a promotion, which may reflect perceptions of bargaining power and employer's level of flexibility with wages. The share asking for a raise was also down 3 percentage points from 2022.10
Figure 7. Asking for and receiving a raise
Accessible Version | Return to text
Note: Among all workers.
Moving to New and Better Jobs
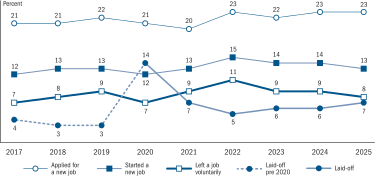
Another way of understanding the health of the labor market is by looking at whether people are moving to new jobs, and particularly if those jobs are better than the last ones. These measures also indicated a solid but softening labor market in 2025 (figure 8). The shares starting a new job and leaving a job voluntarily were similar to those seen in 2018.
Figure 8. New jobs and separations (by year)
Accessible Version | Return to text
Note: Among all adults. Layoffs from 2019 and earlier are not directly comparable with those from 2020 and after because of a change in the question format in 2020.
Yet, softening was apparent both in higher layoffs and in a lower share of people who left a job voluntarily. Seven percent of all adults said that they were laid off in 2025, up from 6 percent in 2024. Among Black adults, a higher 13 percent were laid off in 2025, up from 10 percent in 2024.11 Additionally, the share of all adults who left a job voluntarily was lower in 2025 (8 percent) relative to 2024 (9 percent) and was down even more since 2022. The steady decline in the share voluntarily leaving a job could signal increasing difficulty finding new jobs.12
Another indication of softening is that the share of adults who started a new job was down to 13 percent in 2025 from a peak of 15 percent in 2022. Furthermore, the decline in the share starting a new job occurred despite no change in the share of adults applying for new jobs. Put together, the trends of stable applications and lower hiring suggest that it was more difficult for workers to move into new jobs in 2025.
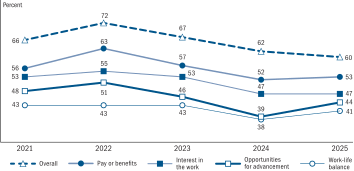
One reason why hiring and job changes are meaningful metrics is that typically people move into a better job than the one they had previously. However, the share of job changes that were into better jobs can vary over time. In 2025, 60 percent of people who changed jobs said that their new job was better (figure 9), which was down from a peak of 72 percent in 2022, but similar to 2024. The shares of job changers reporting improvements in several other characteristics were also similar in 2025 compared with 2024.
Figure 9. Share of job changes with improved characteristics (by year)
Accessible Version | Return to text
Note: Among adults who started a new job and had a different main job than a year ago.
Working from Home and Working Irregular Schedules
Working from home (or teleworking) continued to be common in 2025. In the week before the survey, 39 percent of workers said they worked from home at least some of the time, similar to 2024. Seventeen percent of workers worked entirely from home, and 23 percent did so some of the time.13
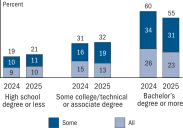
People who completed more education continued to be more likely to work from home. Twenty-three percent of workers with at least a bachelor's degree worked entirely from home compared with 10 percent of those with a high school degree or less (figure 10). Rates of hybrid work also varied markedly by how much education workers had completed.
Figure 10. Amount of work done from home (by education)
Accessible Version | Return to text
Note: Among workers. Key identifies bars in order from top to bottom.
Despite their higher rates of working from home compared with other groups, fewer people with a bachelor's degree worked from home than in other recent years. The share of workers with at least a bachelor's degree who worked from home at least some of the time fell by 5 percentage points in 2025. In contrast, the share working from home at least some of the time was roughly unchanged for people with less than a bachelor's degree.
Self-employed workers also frequently work from home. Thirty percent of the self-employed worked entirely from home, including 22 percent of business owners with paid employees. Going from the pandemic in 2020 to the survey in 2025, the share of the self-employed who worked entirely from home also declined by a smaller 4 percentage points compared with the 14 percentage point decline among people who worked for someone else ("employees").
In addition to working from home, many workers value scheduling that aligns with their lives outside of work.14 Most workers managed these various commitments through regular work schedules, and 10 percent had a schedule that varied at their own request. However, 16 percent had a work schedule that varied based on their employer's needs.
Generative AI and Methods for Doing Work
Generative AI has begun to affect many people's work lives, with one-fourth of workers using it in the prior month (figure 11).15 Generative AI can save workers time, improve the quality of their work, and enable them to do new things. It also could replace some workers altogether. To understand some of these tradeoffs from workers' perspectives, the SHED included questions asking if workers used AI in their jobs and assessing how much they agreed with a series of statements about generative AI.
Figure 11. Perceptions of generative AI
Accessible Version | Return to text
Note: Among workers. Bars give the share of all workers and of workers who used AI who agreed with a statement summarized by the title. The other possible responses are "disagree" and "neither agree nor disagree." Key identifies bars in order from top to bottom.
Saving time was the most cited benefit of AI, with 44 percent of all workers agreeing that generative AI would save time in their job. The 44 percent who agree that generative AI saves time is higher than the 25 percent of workers who said they used AI in their job in the prior month. Smaller shares of workers agreed that generative AI could improve quality and enable them to do new tasks.
Another pattern is that the workers who used generative AI are much more likely to agree that it has benefits and that having AI available will improve their career (figure 11). One cause of these more-positive perceptions could be that workers are more likely to use generative AI in jobs where it is particularly helpful to them. Another possibility is that workers who use AI are observing the specific ways it can increase productivity, leading them to have positive sentiments about how it can lead to career advancement.
There are large differences in generative AI use by educational attainment (table 5). For example, 43 percent of workers with a graduate degree used AI in the prior month, compared with 10 percent of workers with a high school degree or less who used generative AI. Workers with more education were also more likely to agree that their employer encourages them to use AI.
Table 5. Use of and attitudes about generative AI (by education, age, and disability status)
Percent
| Characteristic | Uses generative AI | Employer encourages AI | Will improve career | Worried will replace job |
|---|---|---|---|---|
| Education | ||||
| High school degree or less | 10 | 8 | 12 | 17 |
| Some college or technical degree | 17 | 12 | 17 | 21 |
| Associate degree | 20 | 14 | 18 | 21 |
| Bachelor's degree | 34 | 27 | 25 | 23 |
| Graduate degree | 43 | 31 | 29 | 20 |
| Age | ||||
| 18–29 | 20 | 16 | 19 | 23 |
| 30–44 | 31 | 24 | 24 | 24 |
| 45–59 | 28 | 20 | 21 | 18 |
| 60+ | 13 | 11 | 12 | 14 |
| Disability status | ||||
| Disability | 19 | 15 | 18 | 24 |
| No disability | 25 | 19 | 20 | 20 |
| Overall | 25 | 19 | 20 | 20 |
Note: Among workers. The first column gives the share using generative AI and the others give the share who agree with the statement, regardless of their use of generative AI. The other options are "disagree" and "neither agree nor disagree."
Perhaps contrary to expectations that young adults are the primary users of AI, workers under age 30 were less likely to have used generative AI than workers ages 30 to 59 (table 5). Workers under age 30 also were 4 percentage points more likely to agree that they worried about AI replacing their job than they were to say having AI available would improve their career.
Another group of workers for whom AI may be particularly meaningful are workers with a disability, since changes from AI could have implications for employers' ability and willingness to accommodate them. Workers with a disability were less likely than those without a disability to have used AI in the prior month and more likely to worry about AI replacing their job. They also were less likely to say that their employer encouraged them to use AI, possibly reflecting the different types of jobs held by people with disabilities.
Workers' levels of autonomy can also influence the adoption of new technologies, and this appears to also be the case with generative AI.16 Thirty percent of employees who often or always have control over how to complete tasks reported using generative AI at work. This compares with 20 percent of those with less control over their work who had adopted generative AI tools.
People with higher levels of education also have more autonomy in how they do their jobs, which may contribute to their higher use of generative AI. Sixty-two percent of employees with a bachelor's degree could often or always choose how they complete tasks compared with 55 percent of all employees (table 6).
Table 6. Often or always choosing tasks to work on and how to complete them (by education)
Percent
| Education | What tasks to work on | How to complete tasks |
|---|---|---|
| High school degree or less | 27 | 48 |
| Some college or technical degree | 28 | 46 |
| Associate degree | 32 | 56 |
| Bachelor's degree or more | 36 | 62 |
| Overall | 32 | 55 |
Note: Among employees.
Retirement
Retirees represent a sizeable portion of the adult population. Twenty-seven percent of adults considered themselves to be retired, even though some were still working in some capacity.17
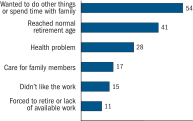
Frequently, multiple factors contributed to when people retired, though many said their decision was based on a preference to retire as opposed to an event that forced them to stop working (figure 12). Fifty-four percent of retirees said a desire to do other things or to spend time with family was important for their decision to retire when they did, and 41 percent said they retired because they reached a normal retirement age.
Figure 12. Reasons for retiring
Accessible Version | Return to text
Note: Among retirees. Respondents could select multiple answers.
Various challenges also affected when people retired. Health problems were a factor for 28 percent of retirees, and 17 percent said they retired in part to care for family members. Just over 1 in 10 said they were forced to retire or that they retired because work was not available. Collectively, health problems, caring for family, and lack of work contributed to the timing of retirement for 46 percent of retirees.
Retiring because of health problems, lack of work, or caring for family was far more common among those with less education. Fifty-three percent of retirees with a high school degree or less cited at least one of these reasons for the timing of their retirement, compared with 37 percent of those with at least a bachelor's degree.
Sixteen percent of retirees also said that they had done some work for pay or profit in the previous month. Part-time work was more common among retirees than full-time work (11 percent and 4 percent of retirees, respectively).
Those working in retirement were more likely to say that this was for nonfinancial reasons than for financial ones. Ten percent of retirees said they worked, at least in part, for nonfinancial reasons such as having a sense of purpose and enjoying social connections (table 7), whereas 8 percent gave financial reasons. Four percent said they were working for both financial and nonfinancial reasons.
Table 7. Reasons for working in retirement
Percent
| Reason | Working retirees | All retirees |
|---|---|---|
| Types of reasons | ||
| Any financial reason | 52 | 8 |
| Any nonfinancial reason | 67 | 10 |
| Specific financial reasons | ||
| Wanted extra spending money | 38 | 6 |
| Needed money to make ends meet | 30 | 5 |
| To save more money, make retirement savings last, or delay claiming Social Security | 27 | 4 |
| Enabled me to give financial support to family or friends | 23 | 3 |
| To keep health insurance | 16 | 2 |
Note: Among retirees. Respondents are first asked if they worked for any financial reason and/or any nonfinancial reason. Respondents who said they worked for a financial reason could select one or more of the specific financial reasons.
The most common financial reasons also were consistent with working being more of a choice than a financial imperative. Six percent of retirees said they worked to have extra spending money, and 4 percent said they worked to save more money or make their savings last longer.
Some people, however, cited stronger financial imperatives. Five percent of retirees said that they worked because they needed money to make ends meet. Another 2 percent of retirees said that they worked to keep their health insurance. Retirees who said they worked to keep their health insurance were younger than retirees overall. Seventy-four percent of retirees who said they were working to keep their health insurance were under age 65 and likely ineligible for Medicare.
References
10. The question asks workers if they received any raise, not the amount. It also does not adjust for inflation, meaning that workers who received raises could be earning less after adjusting for inflation. These differences between real and nominal earnings are particularly meaningful in years with high inflation, like 2022. Return to text
11. White adults saw a smaller increase in layoffs—up 1 percentage point to 5 percent in 2025. Return to text
12. Seventy-one percent of people who voluntarily left a job started a new one. Additionally, workers may be more willing to temporarily leave the labor force if they have confidence that they will be able to find a job if they want one in the future. This link between the number of quits and people's expectations of their ability to find a job is illustrated by Kathrin Ellieroth and Amanda Michaud, "Quits, Layoffs, and Labor Supply," Opportunity and Inclusive Growth Working Paper No. 94 (Minneapolis: Federal Reserve Bank of Minneapolis, January 2026), https://doi.org/10.21034/iwp.94. Return to text
13. People who worked from home some of the time typically did so one or two days per week. Thirteen percent of all workers (59 percent of those working from home some of the time) were working from home one or two days per week. Return to text
14. Surveys and experiments in some workplaces have shown that workers value schedule flexibility, among other job characteristics. These include Alexandre Mas and Amanda Pallais, "Valuing Alternative Work Arrangements," American Economic Review 107, no. 12 (2017): 3722–59, https://doi.org/10.1257/aer.20161500; Matthew Wiswall and Basit Zafar, "Preference for the Workplace, Investment in Human Capital, and Gender," The Quarterly Journal of Economics 133, no. 1 (2018): 457–507, https://doi.org/10.1093/qje/qjx035; and Nicole Maestas, Kathleen J. Mullen, David Powell, Till von Wachter, and Jeffrey B. Wenger, "The Value of Working Conditions in the United States and the Implications for the Structure of Wages," American Economic Review 113, no. 7 (2023): 2007–47, https://doi.org/10.1257/aer. Return to text
15. The SHED question about use of generative AI defines it as a type of artificial intelligence that creates text, images, audio, or video in response to prompts. It gave the examples of AI platforms while instructing respondents to exclude seeing AI results from search engines. This question was based on one fielded in Alexander Bick, Adam Blandin, and David Deming, "The Rapid Adoption of Generative AI," Management Science, forthcoming (2026), https://doi.org/10.1287/mnsc.2025.02523. Return to text
16. As an example of autonomy affecting the costs and benefits of adopting new technologies, previous research found that computerized "information technologies" are more productive in decentralized organizations with more dispersed decisionmaking (Lorin M. Prasanna Hitt and Erik Brynjolfsson, "The Extroverted Firm: How External Information Practices Affect Innovation and Productivity," Management Science 58, no. 5 (2012): 843–59, 2012, https://doi.org/10.1287/mnsc.1110.1446). Return to text
17. Retirees are defined here based on a question asking all respondents whether they are retired or not, regardless of their employment status. One reason people could consider themselves to be retired while still working is if they had worked in a field with a relatively young retirement age, like the military or air traffic controllers—18 percent of retirees working full time had served on active duty in the U.S. Armed Forces. Another related reason could be receiving a pension or Social Security—28 percent of full-time working retirees were receiving a pension, and 45 percent were receiving Social Security. Return to text