


Living Arrangements and Care Work
Meeting childcare and eldercare needs can be a challenge for families' budgets. Paid childcare often costs more than half as much as a family's housing payment. In addition to childcare responsibilities, many households also provided care for an adult, such as an elderly parent.
Providing care for children and adults who need assistance disproportionately fell on women. Mothers of children under age 13 were much more likely than fathers to say they were their children's primary caretaker, even when both parents worked. Additionally, many mothers reported that they were not working at least in part because of their childcare responsibilities.
Living Arrangements
Households and living arrangements come in various forms. Most frequently, people lived with a spouse, partner, or children under age 18 (table 8). Yet, 33 percent of adults lived in households with at least two generations of adults. Specifically, 19 percent of adults lived with their adult children (age 18 or older), and 15 percent lived with a parent. Two percent of adults simultaneously lived with their parent and an adult child.
Table 8. Other people living in the household
| Relationship | Percent |
|---|---|
| Spouse or partner | 65 |
| Children under age 18 | 26 |
| Adult children | 19 |
| Parents | 15 |
| Brothers or sisters | 7 |
| Other relatives | 5 |
| Other non-relatives | 6 |
| Lives with someone else | 87 |
Note: Among all adults. Respondents could select multiple answers.
The share of young adults who live with their parents has increased in recent years. In 2025, 49 percent of adults under age 30 lived with a parent. This share was up by 6 percentage points since 2022, and up 12 percentage points since 2019, just before the pandemic.
Conversely, adults age 60 and older were more likely to live alone than were younger adults. Overall, 13 percent of people lived alone in 2025. Among those ages 60 and older, a higher 20 percent were living alone.
Living arrangements were also related to caregiving needs. Sixty-one percent of people who cared for an adult child also said that they lived with an adult child, which is more than three times the 19 percent of all adults who lived with an adult child overall. Similarly, 36 percent of people who cared for a parent lived with a parent in the household, which is more than double the share of all adults who lived with a parent.
Childcare
Most parents of young children (under age 13) did not use paid childcare in 2025. Specifically, one-fourth of parents of young children used paid childcare in the week before the survey. Even among parents living with their children under age six, a modest 34 percent used paid childcare in the past week.
Use of paid childcare also varied substantially by family income, with higher-income parents being more likely to use paid childcare, and to use it more intensively (table 9). For example, 35 percent of parents of young children with an income of $100,000 or more used paid childcare. Twenty-one percent of these higher-income families used 20 or more hours of childcare per week.
Table 9. Hours of paid childcare used in the past week (by family income)
Percent
| Family income | 1–19 hours | 20 or more hours | Any paid childcare |
|---|---|---|---|
| Less than $50,000 | 9 | 6 | 15 |
| $50,000–$99,999 | 8 | 9 | 18 |
| $100,000 or more | 13 | 21 | 35 |
Note: Among adults living with their own children under age 13.
Childcare costs can be substantial. The median weekly amount that parents paid for childcare was $250, and $350 among those who used paid childcare for at least 20 hours each week.
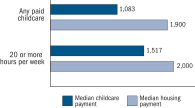
Comparing childcare costs to housing, most people's single largest monthly expense, shows how meaningful these childcare costs can be (figure 13). Median monthly childcare payments were $1,083, which is over half of the median housing payment (either a mortgage or rent) of $1,900 among families who paid for both housing and childcare. Families who used at least 20 hours of childcare also paid substantially more, with a median of $1,517 per month, which is more than three-quarters of the median housing payment of $2,000 among families who paid for housing and who used at least 20 hours of childcare per week. Most families who paid for both childcare and housing spent at least 50 percent as much on childcare as on housing.
Figure 13. Median monthly childcare and housing payments (by hours of childcare used)
Accessible Version | Return to text
Note: Among adults with a positive value of the expense who pay for the specified amount of childcare. Housing costs are total monthly mortgage payments for homeowners and total monthly rents for renters. Weekly childcare costs are multiplied by 52/12 to obtain a monthly figure. Key identifies bars in order from top to bottom.
More parents used unpaid childcare than paid for childcare. Among those with children under age 13, 44 percent used some form of unpaid childcare. Among those with children under age six, half did so. However, most parents who used unpaid childcare did not use it very often. Fifty-seven percent of those who used unpaid childcare relied on it for less than 10 hours per week. Unpaid childcare was typically provided by a relative of the child—generally a grandparent (table 10).
Table 10. Providers of unpaid childcare
| Provider | Percent |
|---|---|
| Child's grandparents | 28 |
| Child's sibling | 8 |
| Another relative other than the parents | 10 |
| A nonrelative such as a friend or neighbor | 5 |
| Headstart or another preschool that you don't pay for | 3 |
| Other provider | 2 |
| Any unpaid childcare | 44 |
Note: Among adults living with their own children under age 13. Respondents could select multiple answers.
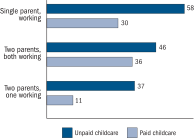
Managing childcare often involves tradeoffs between work, budgets, and children's needs that families solve in different ways. Fifty-eight percent of working single parents used unpaid childcare of some form (figure 14), above the average for all parents. Among two-working-parent households, 36 percent used paid childcare—similarly above the average for all parents. Households with one working and one non-working parent, in contrast, were less likely to use both types of childcare, at 37 percent for unpaid and 11 percent for paid childcare.
Figure 14. Forms of childcare used (by family type and employment status)
Accessible Version | Return to text
Note: Among adults living with their own children under age 13. Key identifies bars in order from top to bottom.
Mothers are the primary caretaker in many families. Among adults living with their spouse or partner and their young children, 58 percent of mothers said they are usually the primary caretaker when their children are home, compared with 12 percent of fathers.18 The same patterns also apply to dual-earner couples, where 49 percent of these working moms said they were the primary caretaker compared with 8 percent of working dads. Additionally, 78 percent of single parents of children under 13 were single mothers.
Women's higher likelihood of being primary caretakers, the cost of childcare, and women's typically lower earnings all contribute to lower rates of employment among women relative to men.19 Among parents living with their children under age 13, 37 percent of mothers were not working for pay, compared with 18 percent of fathers. Additionally, among these non-working parents of young children, women were more likely to say that childcare responsibilities contributed to that choice. Forty-one percent of mothers who were not working said that this was at least in part due to childcare, compared with 25 percent of non-working fathers.
Childcare responsibilities also contributed to parents working part time, particularly mothers. Sixteen percent of mothers of children under age 13 worked part time, which is higher than the 4 percent of fathers. Among these parents, 44 percent said childcare contributed to them working part time as opposed to full time.
Caring for Other Adults
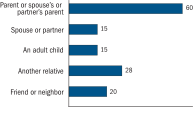
Another type of unpaid care work is caring for an aging parent, spouse, partner, or adult child (age 18 or older) who requires assistance. Eighteen percent of adults regularly provided unpaid care for an adult relative or friend needing assistance because of aging, disability, or illness. Most frequently, this care was provided to a parent or a spouse's or partner's parent (figure 15).
Figure 15. Relationship to those you provide unpaid care for because of aging, disability, or illness
Accessible Version | Return to text
Note: Among adults who provided unpaid care for an adult because of aging, disability, or illness.
Unpaid caregiving responsibilities varied by demographic characteristics. Women were more likely to provide unpaid care to other adults than men (table 11). Black, Hispanic, and Asian adults were more likely to provide unpaid care than White adults. Additionally, adults ages 45 to 59 were the most likely age group to provide unpaid care, likely reflecting the age range when one's parents are most likely to need care.
Table 11. Provides unpaid care to adults due to aging, disability, or illness (by demographics)
| Characteristic | Percent |
|---|---|
| Age | |
| 18–29 | 15 |
| 30–44 | 15 |
| 45–59 | 23 |
| 60+ | 18 |
| Race/ethnicity | |
| White | 16 |
| Black | 21 |
| Hispanic | 20 |
| Asian | 19 |
| Male/female | |
| Male | 16 |
| Female | 19 |
| Overall | 18 |
Note: Among all adults.
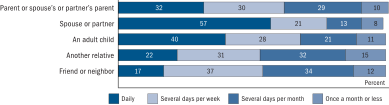
Most of those who reported adult caregiving responsibilities provided care at least weekly, including the vast majority of those caring for their spouse or partner (figure 16).20 Thirty-two percent of all people who provided care to another adult provided care daily, and 60 percent provided care at least weekly. Providing care for a disabled adult child frequently has daily care responsibilities, as 40 percent of those who provided care for an adult child did so daily.
Figure 16. Frequency of unpaid care (by recipient)
Accessible Version | Return to text
Note: Among adults who provided unpaid care for an adult because of aging, disability, or illness. Key identifies bars in order from left to right.
Like childcare, providing regular care for other adults can make it difficult to do other work for pay. Among prime-age adults, 32 percent who were caring for another adult did not have a paid job, compared with 23 percent of those who did not have these caretaking responsibilities. Fifteen percent of prime-age adults who care for another adult specifically said that caregiving for another adult contributed to them not working. Disruptions to one's ability to do other work was even greater among those with daily caretaking responsibilities—44 percent did not work for pay and 29 percent said caregiving contributed to them not working for pay.
References
18. Respondents were asked whether they are the primary caretaker, their spouse is the primary caretaker, or if caregiving responsibilities are equally distributed. One disconnect in responses is that mothers are less likely to say that responsibilities are shared equally than are fathers, with 34 percent of mothers saying that they split responsibilities equally compared with 54 percent of fathers. Mothers are also more likely to say that they are the primary caretaker, at 58 percent, than fathers are to say that their partner is the primary caretaker, at 35 percent. Return to text
19. For an overview of these and other factors likely influencing women's employment rates in a long-term, international perspective, see Claudia Goldin, "Nobel Prize Lecture," Nobel Prize Outreach (December 2025), https://www.nobelprize.org/prizes/economic-sciences/2023/goldin/lecture/. Return to text
20. The question asks if people regularly provide unpaid help or care, so people who provide care irregularly or at a very low frequency may have answered "no." Including these irregular or infrequent caregivers would increase the number of people with adult caregiving responsibilities and decrease the average frequency that people provide care. Return to text