


Savings and Investments
Having a buffer of savings for emergencies can help families cope with income fluctuations and with unexpected expenses. The share of adults who would pay for an unexpected $400 expense with cash or the equivalent was unchanged from 2024, and the share who said they had rainy day funds to cover three months of expenses was unchanged from 2024 as well.
Saving and investing are also important for longer-run financial security, including in retirement. Among adults who were not retired, the share who felt that their retirement savings plan was on track was unchanged from 2024. That said, each of these three measures of preparedness—the share of adults who would pay for an unexpected $400 expense with cash or the equivalent, the share who could cover three months of expenses with a rainy day fund, and the share of non-retirees saying that their retirement savings plan was on track— was down from 2021.
Emergency Savings and Unexpected Expenses
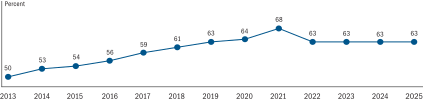
Relatively small, unexpected expenses, such as those discussed in the "Economic Hardships" section of this report, can be a challenge for families without a financial cushion. When faced with a hypothetical expense of $400, 63 percent of all adults said they would have covered it exclusively using cash, savings, or a credit card paid off at the next statement (referred to, altogether, as "cash or its equivalent").36 The remainder said they would have paid by borrowing or selling something or said they would not have been able to cover the expense. The share who would pay using cash or its equivalent was unchanged from the past several years (figure 24).
Figure 24. Would cover a $400 emergency expense completely using cash or its equivalent (by year)
Accessible Version | Return to text
Note: Among all adults.
Among the 37 percent of adults who would not have covered a $400 expense completely with cash or its equivalent, most would pay some other way, although some said that they would be unable to pay the expense at all. For those who could cover the expenses another way, the most common approach was to use a credit card and then carry a balance, and many indicated they would use multiple approaches. However, 12 percent of all adults said they would be unable to pay the expense by any means (table 25), down slightly from 13 percent in 2024.
Table 25. Other ways individuals would cover a $400 emergency expense
| Approach | Percent |
|---|---|
| Put it on a credit card and pay it off over time | 15 |
| Borrow from a friend or family member | 10 |
| Sell something | 7 |
| Use money from a bank loan or line of credit | 3 |
| Use a payday loan, deposit advance, or overdraft | 2 |
| Would not be able to pay for the expense right now | 12 |
Note: Among all adults. Respondents could select multiple answers.
Some of those who would not have paid an unexpected $400 expense completely with cash or its equivalent likely still had access to $400 in cash. Instead of using that cash to pay for the expense, they may have chosen to preserve their cash as a buffer for other expenses.
To explore this potential difference between how people would pay for a small, unexpected expense and whether they could pay for it with cash or the equivalent, the survey included a question asking people what the largest emergency expense was that they could handle using only savings. Eighteen percent of adults said the largest emergency expense they could handle right now using only savings was under $100, and 12 percent said they could handle an expense of $100 to $499 (table 26).
Table 26. Largest emergency expense individuals could handle right now using only savings
| Amount | Percent |
|---|---|
| Less than $100 | 18 |
| $100–$499 | 12 |
| $500–$999 | 9 |
| $1,000–$1,999 | 11 |
| $2,000-$4,999 | 12 |
| $5,000 or more | 38 |
Note: Among all adults.
Seventy percent of adults said they could pay an expense of at least $500 using only their current savings (table 26).37 This is a somewhat larger share than the 63 percent of adults who said they would pay an unexpected $400 expense with cash or the equivalent, suggesting that some people choose to pay with other methods, even if they have cash savings available to them.38
Some financial challenges, such as a job loss, require more financial resources than would an unexpected $400 expense. One common measure of financial resiliency is whether people have savings sufficient to cover three months of expenses if they lost their primary source of income. In 2025, 55 percent of adults said they had set aside money for three months of expenses in an emergency savings or "rainy day" fund—unchanged from 2024 but down from a high of 59 percent in 2021.39
For those who did not set aside money for this purpose, some would have dealt with a loss of their main source of income by borrowing, selling assets, or drawing on other savings. Fifteen percent of all adults said that they could have covered three months of expenses in this way. Thirty percent of adults indicated they could not cover three months of expenses by any of these means.
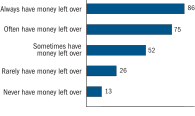
Spending less than income on a regular basis is one way to build an emergency fund, and people who did so more frequently were more likely to report they had a rainy day fund. Eighty-six percent of adults who said they always had money left over at the end of the month said they had savings to cover three months of expenses, while 13 percent of those who never had money left over at the end of the month had such savings (figure 25).
Figure 25. Have savings to cover three months of expenses (by how often have money left over at end of the month)
Accessible Version | Return to text
Note: Among all adults.
The share of adults who had emergency savings to cover three months of expenses varied across demographic groups. Older adults, those with higher incomes, Asian adults, and men were more likely than other adults to say they had this level of emergency savings (table 27).
Table 27. Have savings to cover three months of expenses (by demographic characteristics)
| Characteristic | Percent |
|---|---|
| Family income | |
| Less than $25,000 | 21 |
| $25,000–$49,999 | 39 |
| $50,000–$99,999 | 55 |
| $100,000 or more | 75 |
| Age | |
| 18–29 | 37 |
| 30–44 | 49 |
| 45–59 | 55 |
| 60+ | 71 |
| Race/ethnicity | |
| White | 61 |
| Black | 38 |
| Hispanic | 43 |
| Asian | 68 |
| Disability status | |
| Disability | 40 |
| No disability | 60 |
| Male/female | |
| Male | 57 |
| Female | 53 |
| Overall | 55 |
Note: Among all adults.
Retirement Savings and Investments
Saving for retirement is important in preparing for expenses later in life. Most adults had at least some savings in a tax-preferred retirement account, defined benefit pension, or other asset that they may be able to tap to meet expenses in retirement.40 Sixty-seven percent of adults had assets that are specifically designated for producing income in retirement. This share included the 61 percent of adults who had a tax-preferred retirement account, including employer-sponsored defined contribution plans such as 401(k)s, individual retirement accounts (IRA), or Roth IRAs. It also included 29 percent who had a defined benefit pension through an employer (table 28).41
Table 28. Types of assets (by age)
Percent
| Assets | 18–24 | 25–54 | 55–64 | 65+ | Overall |
|---|---|---|---|---|---|
| Tax-preferred retirement accounts and pensions | |||||
| Tax-preferred retirement account, such as a 401(k) or IRA | 28 | 63 | 73 | 62 | 61 |
| Defined benefit pension through an employer | 5 | 20 | 39 | 52 | 29 |
| Have tax-preferred retirement account or pension | 29 | 66 | 79 | 78 | 67 |
| Other assets | |||||
| Own home | 19 | 57 | 82 | 84 | 63 |
| Savings or money market account, or certificate of deposit (CD) | 45 | 52 | 67 | 76 | 59 |
| Stocks, bonds, ETFs, or mutual funds held outside a retirement account | 18 | 33 | 45 | 48 | 37 |
| Cash value in a life insurance policy | 7 | 22 | 30 | 33 | 24 |
| Business or real estate | 2 | 9 | 18 | 16 | 11 |
| Have tax-preferred retirement account, pension, or other assets listed above | 66 | 82 | 93 | 95 | 85 |
Note: Among all adults. Respondents could select multiple answers. ETFs are exchange-traded funds.
Consistent with the declining prevalence of employer-sponsored defined benefit plans in recent decades and the greater likelihood of vesting with age and more years of service, younger adults were much less likely to have defined benefit pensions.42 Among prime-age adults (ages 25 to 54), 20 percent had a defined benefit pension, compared with 39 percent of those ages 55 to 64 and 52 percent of those age 65 and older (table 28).
On the other hand, the growing prevalence of employer-sponsored defined contribution plans such as 401(k)s in recent decades is reflected in the substantial share of adults who had tax-preferred retirement accounts. Among those ages 55 to 64 who were nearing common retirement ages, 73 percent had tax-preferred retirement savings accounts—higher than shares of prime-age adults and those age 65 and older who had these accounts (63 percent and 62 percent, respectively).
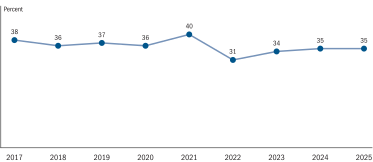
While most non-retired adults had some type of tax-preferred retirement account (such as a 401(k), IRA, or Roth IRA) or a defined benefit pension, a lower 35 percent of non-retirees thought their retirement saving was on track.43 The share of non-retirees who thought their retirement saving was on track was unchanged compared with 2024 (figure 26).
Figure 26. View retirement savings plan as on track (by year)
Accessible Version | Return to text
Note: Among non-retirees.
Retirement savings and perceived preparedness differed across demographic groups. Lower-income adults, younger adults, women, as well as Black and Hispanic adults, were less likely than others to have tax-preferred retirement accounts or defined benefit pensions (table 29). They also were less likely to view their retirement savings plan as on track.
Table 29. Retirement preparedness among non-retirees (by demographic characteristics)
Percent
| Characteristic | Tax-preferred retirement account | Defined benefit pension | Retirement savings on track |
|---|---|---|---|
| Family income | |||
| Less than $25,000 | 15 | 3 | 7 |
| $25,000–$49,999 | 38 | 9 | 16 |
| $50,000–$99,999 | 65 | 21 | 29 |
| $100,000 or more | 89 | 33 | 59 |
| Age | |||
| 18–29 | 38 | 8 | 22 |
| 30–44 | 65 | 18 | 35 |
| 45–59 | 74 | 31 | 43 |
| 60+ | 76 | 36 | 53 |
| Race/ethnicity | |||
| White | 69 | 23 | 43 |
| Black | 49 | 20 | 23 |
| Hispanic | 46 | 16 | 24 |
| Asian | 78 | 22 | 43 |
| Disability status | |||
| Disability | 34 | 12 | 15 |
| No disability | 67 | 22 | 39 |
| Male/female | |||
| Male | 63 | 22 | 39 |
| Female | 60 | 20 | 32 |
| Overall | 61 | 21 | 35 |
Note: Among non-retirees.
Non-retirees with a disability were also less likely to have designated retirement assets and to view their savings as on track (table 29). Adults with a disability were less likely to be employed, and some means tested benefits received by those with disabilities have asset limits that deter the accumulation of savings.44 These factors may contribute to the lower share of adults with a disability who have designated retirement assets.
Although money in retirement accounts is intended to be preserved for retirement, occasionally these savings can also act as a source of emergency funds for non-retirees who face economic hardships. Others may increase their disposable income by reducing regular contributions to retirement accounts. In the prior 12 months, 5 percent of non-retired adults borrowed money from their retirement accounts; 4 percent cashed out funds from their retirement accounts; and 8 percent reduced their regular contributions to their account. The shares of non-retirees taking these actions were unchanged from 2024.45 Collectively, 14 percent of non-retirees borrowed from, cashed out, or reduced contributions to their retirement accounts in the prior 12 months.
Non-retirees who had a major unexpected expense were more likely to have tapped the funds in their retirement accounts by borrowing or cashing out, and more likely to have reduced their regular contributions to retirement accounts, compared with other adults (table 30). Non-retirees who experienced a layoff also were more likely to have cashed out money from retirement accounts and to have reduced their regular contributions.46 (For details on the types of major unexpected expenses that people experienced, see the "Economic Hardships" section of this report. For discussion of layoffs, see the "Employment and Job Quality" section.)
Table 30. Non-retirees who borrowed from, cashed out, or reduced contributions to their retirement accounts in the prior 12 months (by economic hardship)
Percent
| Hardship | Borrowed money | Cashed out money | Reduced regular contributions |
|---|---|---|---|
| Had a major unexpected expense | |||
| Yes | 7 | 5 | 10 |
| No | 3 | 2 | 4 |
| Laid off from a job | |||
| Yes | 6 | 9 | 15 |
| No | 5 | 4 | 7 |
| Overall | 5 | 4 | 8 |
Note: Among non-retirees.
Tapping retirement accounts and reducing regular contributions can help people handle economic hardships or other changes to income or expenses, but this may come at a cost to their longer-term financial security. While 35 percent of non-retirees overall said their retirement savings plan was on track, the share who thought their plan was on track was slightly lower among non-retirees who had borrowed money from their accounts or reduced their regular contributions to retirement accounts in the prior 12 months (32 percent for each). Among non-retirees who had cashed out funds from their retirement accounts in the prior year, the share who said they were on track was notably lower, at 24 percent.
Given the importance of retirement savings accounts and other self-directed investments, individuals need to have the skills and knowledge required to manage their own investments or to select a paid professional to do so. People varied in their comfort with choosing and managing their investments.47 Forty-seven percent of adults said they were mostly or very comfortable choosing and managing their investments, while 53 percent of adults said they were not comfortable or only slightly comfortable.
A higher share of men expressed comfort about managing their investments than women. Fifty-five percent of men said they were mostly or very comfortable choosing and managing their investments, while 39 percent of women gave these responses. Confidence also is related to having experience with investments. Among people with tax-preferred retirement accounts or who held stocks, bonds, ETFs, or mutual funds outside a retirement account, 54 percent expressed confidence, compared with 32 percent of those who did not have these accounts.
References
36. Since 2013, when this question was first asked, median household income increased as did consumer prices. Between October 2013 and September 2025, price levels increased by 35 percent based on the Chained Consumer Price Index (https://fred.stlouisfed.org/series/SUUR0000SA0). Median household income from 2013 to 2024, the most recent year of data available, increased even faster—rising 56 percent in nominal terms (20 percent after adjusting for inflation) https://fred.stlouisfed.org/series/MEHOINUSA646N and https://fred.stlouisfed.org/series/MEHOINUSA672N). To check how changes in price levels affect responses to this question, the 2022 survey asked one-fifth of respondents how they would handle a $500 expense instead. Changing the threshold only altered the share who would pay in cash by 0.5 percentage points, suggesting that shifts in the price level have not materially affected the trend in this series. Return to text
37. In the 2025 SHED, this question was changed slightly. In 2025, the survey included a randomized split sample where approximately 50 percent of the respondents received the question as fielded from 2022 to 2024 with the top category listed as $2,000 or more. The remaining 50 percent received a version of the question where the $2,000 or more category was split into two categories: $2,000–$4,999 and $5,000 or more to better align with questions on major unexpected expenses. Overall, the results of the new question are very similar to the original question. The share who could pay an expense of $500 or more using only savings was 68 percent for the original version of the question versus 70 percent for the new version shown in the text, which is not a statistically significant difference. Tabulations of both versions of the question in the 2025 split sample are included in appendix B of this report. Return to text
38. The distinction between how people would or could pay small emergency expenses is discussed further in box 3 from Board of Governors of the Federal Reserve System, Report on the Economic Well-Being of U.S. Households in 2019, Featuring Supplemental Data from April 2020 (Washington: Board of Governors, May 2020), https://www.federalreserve.gov/publications/files/2019-report-economic-well-being-us-households-202005.pdf. Return to text
39. Fifty percent of adults said they could cover an expense of $2,000 or more using savings. Yet, a higher 55 percent said they had rainy day savings to cover three months of expenses, which likely would require more than $2,000 for many families. One possible explanation for this difference in the responses is that the framing of the question about the largest emergency expense people could handle with savings was "right now." There may be assets, such as retirement funds, that some people would consider tapping in the event they went three months without a job that they would not consider tapping right now for an emergency. Return to text
40. While the assets listed here include many sources that people could tap to generate income for retirement, they do not reflect all types of assets people may hold. For example, as discussed in the "Banking" section of this report, most adults have a checking or other transaction account. The Survey of Consumer Finances (SCF) provides detailed estimates of the types of assets and liabilities held by U.S. households and the value of their holdings. For the most recent estimates from the SCF, see Aditya Aladangady, Jesse Bricker, Andrew C. Chang, Sarena Goodman, Jacob Krimmel, Kevin B. Moore, Sarah Reber, Alice Henriques Volz, and Richard A. Windle, Changes in U.S. Family Finances from 2019 to 2022: Evidence from the Survey of Consumer Finances (Washington: Board of Governors of the Federal Reserve System, October 2023), https://doi.org/10.17016/8799. Return to text
41. Accounts such as 401(k) plans, IRAs, and Roth accounts are tax preferred in that they receive favorable tax treatment to incentivize retirement savings. Return to text
42. For history on IRAs, see Congressional Research Service (CRS), Individual Retirement Account (IRA) Ownership: Data and Policy Issues (Washington: CRS, December 9, 2020), https://crsreports.congress.gov/product/pdf/R/R46635/3. For recent context on employer-sponsored retirement plans, see Congressional Research Service, A Visual Depiction of the Shift from Defined Benefit (DB) to Defined Contribution (DC) Pension Plans in the Private Sector (Washington: CRS, March 25, 2026), https://crsreports.congress.gov/product/pdf/IF/IF12007. Return to text
43. As noted in the "Employment and Job Quality" section of this report, retirement status is based on a question asking all respondents whether they are retired or not, regardless of their employment status. The question asking non-retirees about whether their retirement savings plans was on track did not prompt respondents to consider any particular type of assets or level of income in their answer, and so survey respondents could determine for themselves what they considered on track. Return to text
44. Among prime age adults, 49 percent of adults with a disability worked for pay in the prior month, compared with 80 percent of adults without a disability. As an example of means testing, SSI recipients must have limited income and resources to qualify for benefits. See Social Security Administration, Red Book: A Guide to Work Incentives and Employment Supports for Persons Who Have a Disability under the Social Security Disability Insurance (SSDI) and Supplemental Security Income (SSI) Programs, SSA Publication No. 64-030, August 2023, https://www.ssa.gov/redbook/. Return to text
45. In some cases, these reductions in contributions may be due to job changes or job loss that prevent the individual from continuing to contribute at the same amount. The question on borrowing from or cashing out retirement savings was changed on the 2024 survey, so is not directly comparable with earlier years. Return to text
46. For more on early withdrawals and the relationship with economic shocks and income, see Robert Argento, Victoria L. Bryant, and John Sabelhaus, "Early Withdrawals from Retirement Accounts during the Great Recession," Contemporary Economic Policy 33, no. 1 (2015): 1–16. Return to text
47. The question asked about choosing and managing investments but did not specify a type of investment, so people could answer according to the assets they considered to be investments. This question wording was changed in the 2023 survey and asked of all respondents rather than just non-retirees with self-directed accounts. Return to text