


Economic Hardships
Measures of difficulties covering expenses—including not paying all bills and sometimes or often not having enough to eat—were similar to 2024, although the share who skipped medical expenses due to cost declined. Among those who struggled with paying bills in the prior month, the most common ways they coped were cutting back on other expenses and paying a bill late.
The majority of adults had at least one type of major, unexpected expense in the prior 12 months. The most common unexpected expenses were a major vehicle repair or replacement, followed by a major house or appliance repair and unexpected major medical expenses.
Bills and Regular Expenses
A key measure of a person's financial situation is whether they can afford to pay their regular bills. Sixteen percent of adults said they did not pay all their bills in full in the month prior to the survey, similar to 2024.30
Low-income adults were particularly likely to struggle with monthly bills. In the month prior to the survey, 34 percent of adults with an income less than $25,000 did not pay all their bills in full, compared with 7 percent of adults with an income of $100,000 or more (table 19). Young adults, Black and Hispanic adults, and adults with a disability were also less likely to have paid all their bills in full in the prior month. However, the rate of bill payment for these demographic groups was generally unchanged from the prior year.
Table 19. Did not pay all bills in full in prior month (by demographic characteristics)
| Characteristic | Percent |
|---|---|
| Family income | |
| Less than $25,000 | 34 |
| $25,000–$49,999 | 26 |
| $50,000–$99,999 | 13 |
| $100,000 or more | 7 |
| Age | |
| 18–29 | 24 |
| 30–44 | 20 |
| 45–59 | 16 |
| 60+ | 9 |
| Race/ethnicity | |
| White | 10 |
| Black | 32 |
| Hispanic | 25 |
| Asian | 12 |
| Disability status | |
| Disability | 24 |
| No disability | 14 |
| Overall | 16 |
Note: Among all adults. For credit cards, "did not pay in full" is defined as paying less than the minimum payment amount.
In addition to those who did not pay all of their bills last month, some people paid all their bills but had difficulty doing so. In 2025, the SHED included a new question asking people who paid all their non-credit card bills in the prior month if they had difficulty paying their bills. Including both those who missed a bill and those who had difficulty, 28 percent of adults struggled with paying bills in the prior month.
To understand more about how people cope with difficulties paying bills, the survey asked about some specific actions taken to alleviate these challenges. Fifty-nine percent of adults who struggled with bills in the prior month took steps to manage their cash-flow, most commonly by cutting back on other expenses (table 20).31 Adjusting the timing of bill payments—either with or without the permission of the payee—and borrowing or selling something were similarly common (48 percent). Over two-in-five people who struggled with bills (42 percent) paid one or more bills late, while over one-in-five used a credit card to pay the bill over time (23 percent) or relied on money from friends or family (22 percent). Over half of adults who struggled with bills said that they used two or more of the approaches in table 20.
Table 20. Actions taken by people who struggled to pay bills in the prior month
| Actions | Percent |
|---|---|
| Manage cash flow | |
| Cut back on other expenses | 48 |
| Used money from savings or a retirement account | 18 |
| Increased income, such as by working overtime or taking an extra job | 12 |
| Any manage cash flow | 59 |
| Adjust timing of bill payment | |
| Paid a bill late | 42 |
| Negotiated a lower payment or more time to pay | 16 |
| Any adjust timing of bill payment | 48 |
| Borrow or sell something | |
| Used a credit card that I will pay over time | 23 |
| Borrowed or received money from friends or family | 22 |
| Sold or pawned something | 12 |
| Took out another type of loan, such as payday loan or personal loan | 6 |
| Any borrow or sell something | 48 |
| Other | 11 |
Note: Among adults who did not pay all non-credit card bills in full or who had difficulty paying bills in the prior month. Respondents could select multiple answers.
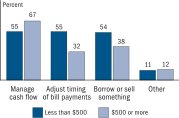
Managing financial constraints without a savings buffer may add another layer of difficulty for those who have problems paying bills. Among adults who struggled with paying bills in the prior month, those who could not cover a $500 emergency using savings were much more likely to cope by adjusting the timing of bill payments (figure 21). They were also more likely to borrow or sell something. Those who could not cover $500 using savings were particularly likely to borrow from friends and family. Eleven percent of those who could cover a $500 expense using savings borrowed from friends or family compared with 27 percent among those who could not.
Figure 21. Actions taken by people who struggled to pay bills in the prior month (by largest emergency expense could handle right now using only savings)
Accessible Version | Return to text
Note: Among adults who did not pay all non-credit card bills in full or who had difficulty paying bills in the prior month. Respondents could select multiple answers. As discussed in the "Savings and Investments" section, this new version of the question about the amount of savings was asked of a randomized half sample. Key identifies bars in order from left to right.
Those who could cover a $500 expense using savings, on the other hand, were more likely to cope with bill payment struggles by managing their cash flow. In particular, they frequently used money from savings or a retirement account. Thirty-two percent of those who could cover a $500 expense using savings used money from savings or a retirement account compared with 12 percent among those who could not.32
Food Sufficiency
Inability to afford food is a particularly severe hardship. Eight percent of adults said that members of their household sometimes or often did not have enough to eat in the prior month, referred to in this report as "food insufficiency."33 The share of adults experiencing food insufficiency has remained essentially unchanged since the question was first asked in 2023.
Twenty-one percent of adults with an income less than $25,000 said members of their household sometimes or often did not have enough to eat in the past month, as did 14 percent of those with income between $25,000 and $50,000. Young adults, Black and Hispanic adults, adults with a disability, and parents living with their children under age 18 were also more likely to report food insufficiency in their household in the prior month than other adults. While the overall share of adults who experienced food insufficiency in the prior month was similar to 2024, a few groups saw changes (table 21).
Table 21. Sometimes or often did not have enough to eat in the prior month (by demographic characteristics)
Percent
| Characteristic | 2025 | 1-year change (since 2024) |
|---|---|---|
| Family income | ||
| Less than $25,000 | 21 | 2 |
| $25,000–$49,999 | 14 | 4 |
| $50,000–$99,999 | 5 | 0 |
| $100,000 or more | 1 | −1 |
| Age | ||
| 18–29 | 12 | 1 |
| 30–44 | 11 | 1 |
| 45–59 | 6 | −1 |
| 60+ | 3 | 1 |
| Race/ethnicity | ||
| White | 5 | 0 |
| Black | 15 | 3 |
| Hispanic | 13 | 1 |
| Asian | 2 | −3 |
| Disability status | ||
| Disability | 15 | 0 |
| No disability | 6 | 0 |
| Parental status | ||
| Parents (living with own children under age 18) | 10 | 1 |
| All other adults | 7 | 0 |
| Overall | 8 | 0 |
Note: Among all adults.
Health-Care Expenses
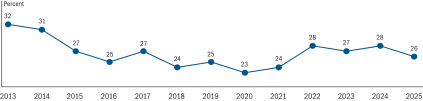
Forgoing medical treatment can be another reflection of financial hardship. Twenty-six percent of adults went without some form of medical care in 2025 because they could not afford it, down from 28 percent in 2024 (figure 22). Dental care was the most frequently skipped, followed by visiting a doctor (table 22). Some people also reported skipping follow-up care, mental health visits, or prescription medicine.
Figure 22. Skipped medical treatment because of cost (by year)
Accessible Version | Return to text
Note: Among all adults.
Table 22. Forms of medical treatment skipped because of cost in the prior 12 months
| Type | Percent |
|---|---|
| Dental care | 18 |
| Seeing a doctor or specialist | 15 |
| Follow-up care | 10 |
| Mental health care or counseling | 10 |
| Prescription medicine | 9 |
| Any treatment | 26 |
Note: Among all adults. Respondents could select multiple answers.
The likelihood of skipping medical care because of cost was strongly related to family income. Among those with income less than $25,000, 38 percent went without some medical care because they could not afford it, compared with 13 percent of adults making $100,000 or more.
Health insurance is one way that people can pay for routine medical expenses and protect against the financial burden of large, unexpected expenses. In 2025, 91 percent of adults had health insurance, down from 92 percent in 2024, but up from the 85 percent who reported having health insurance in 2013 when the survey began.
Those without health insurance were more likely to forgo medical treatment because they could not afford it. Among the uninsured, 45 percent went without medical treatment because they could not afford it, compared with 24 percent among the insured.
In addition to skipping medical care due to cost, some people incur debt to cover medical expenses. Eighteen percent of adults had debt from their own medical care or that of a family member (not necessarily from the past year). The share with outstanding medical debt has ranged from 15 to 18 percent each year since the question was first asked in 2019.
Expense Shocks
Large, unexpected expenses can present a financial challenge, both for covering an unexpected expense and for keeping up with regular bills. The 2025 SHED included new questions on major unexpected expenses, and 59 percent of adults had at least one type of unexpected expense in the prior 12 months (table 23).34 The most common expenses were a major vehicle repair or replacement (30 percent of adults), followed by a major house or appliance repair and unexpected major medical expenses (22 percent and 21 percent, respectively).
Table 23. Major unexpected expenses in the prior 12 months
| Type of expense | Percent |
|---|---|
| A major vehicle repair or replacement | 30 |
| A major house or appliance repair | 22 |
| Unexpected major medical expenses | 21 |
| A mobile phone or computer repair or replacement | 18 |
| Legal expenses, taxes, or fines | 10 |
| Other unexpected expenses | 6 |
| Increases in childcare or dependent care expenses | 3 |
| Any major unexpected expense | 59 |
Note: Among all adults. Respondents could select multiple answers.
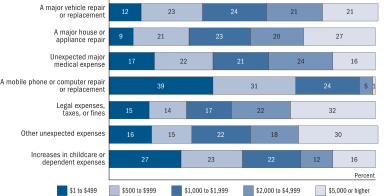
The amounts for the most common major unexpected expenses—vehicle repairs/replacement, house or appliance repairs, and major medical expenses—had similar distributions, with a median cost of $1,000 to $1,999 among those who knew the amount. Legal expenses, taxes, or fines tended to run higher (median of $2,000 to $4,999), while repairing or replacing a mobile phone or computer was typically less expensive (median of $500 to $999, figure 23).35
Figure 23. Amount paid for major unexpected expenses in the prior 12 months (by type of expense)
Accessible Version | Return to text
Note: Among adults who had that type of major unexpected expense in the prior 12 months and who reported the amount. Key identifies bars in order from left to right.
Low-income adults and young adults were less likely to have experienced a major unexpected expense in the prior 12 months, while parents and adults with a disability were more likely to have reported one (table 24). Consistent with home and car repairs being some of the most common unexpected expenses, homeowners and adults who had access to a car were more likely to have had a major unexpected expense (63 percent and 60 percent, respectively).
Table 24. Had a major unexpected expense in the prior 12 months (by demographic characteristics)
| Characteristic | Percent |
|---|---|
| Family income | |
| Less than $25,000 | 47 |
| $25,000–$49,999 | 61 |
| $50,000–$99,999 | 62 |
| $100,000 or more | 62 |
| Age | |
| 18–29 | 49 |
| 30–44 | 63 |
| 45–59 | 65 |
| 60+ | 60 |
| Race/ethnicity | |
| White | 61 |
| Black | 58 |
| Hispanic | 58 |
| Asian | 57 |
| Disability status | |
| Disability | 63 |
| No disability | 58 |
| Parental status | |
| Parents (living with own children under age 18) | 67 |
| All other adults | 57 |
| Overall | 59 |
Note: Among all adults.
Unexpected expenses can also contribute to difficulties covering regular bills and expenses. Collectively, 36 percent of adults reported at least one of the three hardships discussed earlier—being unable to pay bills, not having enough food to eat, or skipping medical treatments due to cost. Among adults who reported facing a major unexpected expense in the past year, a higher share (41 percent) experienced one or more of these hardships. By comparison, a lower 28 percent of adults who did not face a major unexpected expense experienced these hardships.
References
30. In this report, adults who did not pay all their bills in full are those who (1) did not pay a credit card bill or made less than the minimum payment last month or (2) did not pay another type of bill in full last month. Before 2023, respondents were asked a different question about their expected ability to pay all their bills in full this month, and the question did not specify what paying in full meant for credit card bills. Return to text
31. This question was asked of adults who did not pay all non-credit card bills in full or who had difficulty paying bills in the prior month. A small group of respondents who did not pay at least the minimum on a credit card but paid all other bills and did not report any other bill payment struggles were not asked this question about actions taken to alleviate bill payment challenges. Return to text
32. In some cases, people who struggled with paying bills may have limited savings because they depleted their savings to cover bills in the prior month. However, 68 percent of people who did not pay all non-credit card bills or who had difficulty paying bills in the prior month could not cover a $500 emergency expense using savings, while only 18 percent said they used money from savings or a retirement account when they struggled paying bills. Thus, many who struggled with bill payments appear to have had limited savings before the prior month. (For a more detailed breakout of responses to this question on emergency savings, see table 26 in the "Savings and Investments" section of this report.) Return to text
33. The U.S. Department of Agriculture (USDA) defines food insufficiency as sometimes or often not having enough to eat, and marginal food insufficiency as having enough to eat but not always the kinds of foods they wanted to eat. This report focuses on food insufficiency, although the survey also asks about marginal food insufficiency, and an additional 26 percent of adults said that members of their household had enough food to eat but not always the kinds of food they wanted to eat. The SHED food insufficiency question is similar to questions fielded on the Census Household Pulse survey and the annual Current Population Survey Food Security Supplement (CPS-FSS), although the reference periods are different. For details on the definitions of food insufficiency, see the USDA Economic Research Service at https://www.ers.usda.gov/topics/food-nutrition-assistance/food-security-in-the-u-s/measurement/. Return to text
34. The question about unexpected major medical expenses was included on earlier SHED surveys, but the other questions on major unexpected expenses on the 2025 SHED were drawn from questions on the CFPB's Making Ends Meet survey. For data and reports on the results from Making Ends Meet, see https://www.consumerfinance.gov/data-research/making-ends-meet-survey-data/. For a more detailed discussion of expense shocks, see Scott L. Fulford and David Low, "Expense Shocks Matter," CFPB Office of Research Working Paper Series 2024-08, 2024, https://papers.ssrn.com/sol3/papers.cfm?abstract_id=5035531. Return to text
35. Respondents could also answer that they didn't know the amount of the expense, and these responses are omitted from figure 23. The share answering "Don't know" varied by the type of expense, from 3 percent to 15 percent. For the shares including the don't know responses, see appendix B. In answering these questions, respondents determined for themselves whether something was a major expense. Variation across people in what may be considered "major" would affect reporting of the frequency of unexpected expenses and their dollar amounts. Return to text