


Banking
Most adults had a bank account in 2025, but notable gaps in access to financial services still exist, particularly among those with low income, Black and Hispanic adults, and those with a disability.
Adults of all incomes and ages reported experiencing financial fraud and scams, with many unable to recover all their money. Even relatively small dollar losses from fraud and scams were meaningful, especially for adults with limited financial resources to begin with.
Bank Account Ownership
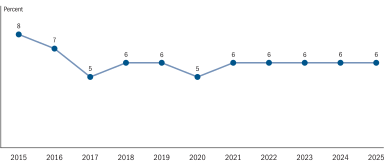
Six percent of adults were "unbanked" in 2025, meaning neither they nor their spouse or partner had a checking, savings, or money market account (figure 27). The unbanked rate has held steady at its current level since 2021.
Figure 27. Unbanked rate (by year)
Accessible Version | Return to text
Note: Among all adults.
Unbanked rates remained far higher among low-income adults. Twenty-one percent of adults with income below $25,000 were unbanked compared with 1 percent of adults with income of $100,000 or more. As in prior years, unbanked rates were also higher among younger adults, Black and Hispanic adults, and adults with a disability (table 31).
Table 31. Bank account ownership and overdraft (by demographic characteristics)
Percent
| Characteristic | Unbanked rate | Paid overdraft fee in prior year (among adults with a bank account) |
|---|---|---|
| Family income | ||
| Less than $25,000 | 21 | 17 |
| $25,000–$49,999 | 8 | 20 |
| $50,000–$99,999 | 3 | 12 |
| $100,000 or more | 1 | 6 |
| Age | ||
| 18–29 | 12 | 15 |
| 30–44 | 8 | 16 |
| 45–59 | 4 | 13 |
| 60+ | 2 | 5 |
| Race/ethnicity | ||
| White | 3 | 8 |
| Black | 13 | 25 |
| Hispanic | 12 | 17 |
| Asian | 3 | 5 |
| Overall | 6 | 12 |
Note: Among all adults.
Since 2021, the survey has asked respondents with a bank account whether they paid an overdraft fee on their bank account. In 2025, 12 percent of adults with a bank account said they paid an overdraft fee in the prior 12 months, similar to the shares seen in recent years, but up 1 percentage point from 2021.
Certain demographic groups were more likely than others to incur an overdraft fee. Among banked adults, higher shares of low- and middle-income adults, Black and Hispanic adults, and adults under age 60 paid an overdraft fee in the prior 12 months (table 31).
Nonbank Check Cashing and Money Orders
Some people go outside of traditional banks and credit unions for certain financial services. Twelve percent of adults used nonbank check cashing or money orders in 2025, similar to recent years, yet down 4 percentage points from 2019, before the pandemic.
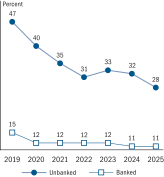
Both banked and unbanked adults used nonbank providers to conduct financial transactions, but the unbanked were much more likely to have done so. Eleven percent of banked adults used a nonbank money order or check cashing service, compared with 28 percent of unbanked adults (figure 28).
Figure 28. Use of nonbank check cashing or money orders (by bank account ownership)
Accessible Version | Return to text
Note: Among all adults.
Use of nonbank money orders and check cashing has fallen among both unbanked and banked adults since 2019. That said, use has flattened out in recent years (figure 28).
Similar to demographic patterns in bank account ownership, use of nonbank check cashing and money orders was more common among those with lower income, Black and Hispanic adults, and adults with a disability (table 32). Use among Black adults was particularly high at 28 percent.
Table 32. Use of nonbank check cashing or money orders (by demographic characteristics)
| Characteristic | Percent |
|---|---|
| Family income | |
| Less than $25,000 | 23 |
| $25,000–$49,999 | 21 |
| $50,000–$99,999 | 12 |
| $100,000 or more | 5 |
| Age | |
| 18–29 | 17 |
| 30–44 | 15 |
| 45–59 | 11 |
| 60+ | 9 |
| Race/ethnicity | |
| White | 8 |
| Black | 28 |
| Hispanic | 18 |
| Asian | 7 |
| Overall | 12 |
Note: Among all adults.
Cryptocurrency
Cryptocurrencies are digital assets that may be held as an investment or used for making financial transactions.48 The 10 percent of adults who used cryptocurrency for either purpose was up 2 percentage points from the prior year. However, this share remained down from 12 percent in 2021, the first time the survey asked about cryptocurrency (table 33).49
Table 33. Cryptocurrency use
Percent
| Reason | 2021 | 2022 | 2023 | 2024 | 2025 |
|---|---|---|---|---|---|
| Bought cryptocurrency or held as an investment | 11 | 8 | 7 | 7 | 9 |
| Used cryptocurrency to buy something or make a payment | 2 | 2 | 1 | 2 | 2 |
| Used cryptocurrency to send money to friends or family | 1 | 2 | 1 | 1 | 1 |
| Any use of cryptocurrency | 12 | 10 | 7 | 8 | 10 |
Note: Among all adults. Respondents could select multiple answers.
Buying or holding cryptocurrency as an investment remained more common than using it for financial transactions. Nearly 1 in 10 adults bought or held cryptocurrency as an investment in the prior year. In contrast, 2 percent of adults said they used cryptocurrency to make a financial transaction, which includes using cryptocurrency to buy something, make a payment, or send money to friends or family (table 33).50
The survey asked those who used cryptocurrency to make financial transactions for the main reason they did so (table 34). At just over one-fourth, the most cited reason was that the person or business receiving the money preferred cryptocurrency, followed by the ability to send the money faster, privacy, and cost. Relatively few transactional cryptocurrency users indicated that either safety or a lack of trust in banks contributed to this choice.
Table 34. Main reason for using cryptocurrency for financial transaction
| Reason | Percent |
|---|---|
| Person or business receiving the money preferred cryptocurrency | 26 |
| To send the money faster | 19 |
| Privacy | 17 |
| Cheaper | 14 |
| Safer | 9 |
| Don't trust banks | 7 |
| Other | 8 |
Note: Among adults who used cryptocurrency for financial transactions.
Consistent with that seen in recent years, the use of cryptocurrency for financial transactions was more common among the unbanked as well as those who used nonbank check cashing and money orders. Six percent of unbanked adults used cryptocurrency for financial transactions, compared with 2 percent among banked adults. Regardless of bank account ownership, those who used nonbank check cashing or money orders had a greater propensity to use cryptocurrency for transactions—8 percent among those who used nonbank check cashing or money orders compared with 2 percent among those who did not. That said, use of cryptocurrency for financial transactions remained very low, even among groups who were more likely to use cryptocurrency in this way.
Financial Fraud and Scams
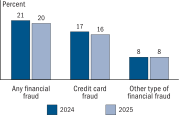
According to data from the Consumer Sentinel Network, the number and severity of financial fraud incidents and scams has spiked in recent years.51 Perpetrators of financial fraud or scams do so in a variety of ways, often involving consumers' credit cards, bank accounts, or investment accounts.52 Two in 10 adults reported that they experienced financial fraud or scams involving their money, with 16 percent reporting fraud related to their credit card, and 8 percent reporting another type of financial fraud. The levels of fraud seen in 2025 were similar to those seen in the prior year (figure 29).
Figure 29. Type of financial fraud
Accessible Version | Return to text
Note: Among all adults. Key identifies bars in order from left to right.
Overall rates of fraud and scams were similar across incomes, though income patterns depended on the type of fraud. Reflecting their higher rates of credit card ownership, adults with higher incomes were more likely than those with lower incomes to experience credit card fraud.53 In contrast, non-credit card fraud was more common among adults with lower income than those with higher income (table 35).
Table 35. Type of financial fraud (by income and age)
Percent
| Characteristic | Any financial fraud | Credit card fraud | Other type of financial fraud |
|---|---|---|---|
| Family income | |||
| Less than $50,000 | 19 | 13 | 10 |
| $50,000–$99,000 | 21 | 16 | 8 |
| $100,000 or more | 21 | 17 | 7 |
| Age | |||
| 18–29 | 13 | 9 | 7 |
| 30–44 | 17 | 13 | 8 |
| 45–59 | 21 | 17 | 8 |
| 60+ | 26 | 22 | 9 |
| Overall | 20 | 16 | 8 |
Note: Among all adults.
Like patterns by income, adults age 45 and older experienced financial fraud at higher rates, largely driven by credit card-related fraud. However, adults of all ages experienced non-credit card fraud at similar rates (table 35).
While credit card fraud was the most common type of financial fraud, consumers are typically not required to cover losses from credit card fraud directly. For this reason, the remainder of the section focuses on fraud not involving credit cards. Among adults experiencing non-credit card-related fraud, 65 percent lost money, and 35 percent said at least some of that money was not recovered.54 The total amount of non-credit-card fraud was an estimated $100 billion in 2025. Consumers reported recovering $44 billion of that, resulting in an estimated net loss of $56 billion borne directly by consumers.55
Before any funds were recovered, half of those experiencing non-credit card-related fraud lost at least $500 and one-fourth lost roughly $1,800 or more.56 Adults with higher income and older adults tended to lose larger amounts of money, likely at least partially because these groups often have more assets to begin with. That said, even smaller dollar losses can be meaningful, especially for those with limited financial resources. Among adults with income less than $50,000, the median loss was $400 (table 36). For perspective on this amount, 40 percent of adults with income less than $50,000 could not cover a $100 emergency expense with only their savings and 61 percent could not cover a $500 expense.
Table 36. Distribution of dollar losses per incident, before any funds were recovered (by income and age)
Dollars
| Characteristic | Income percentile | ||||
|---|---|---|---|---|---|
| 10th | 25th | 50th | 75th | 90th | |
| Family income | |||||
| Less than $50,000 | 50 | 120 | 400 | 1,100 | 4,750 |
| $50,000–$99,999 | 70 | 150 | 400 | 1,787 | 7,000 |
| $100,000 or more | 60 | 200 | 600 | 3,000 | 11,500 |
| Age | |||||
| 18–44 | 50 | 120 | 400 | 1,000 | 3,000 |
| 45–59 | 81 | 175 | 400 | 1,909 | 9,000 |
| 60+ | 58 | 189 | 800 | 3,500 | 15,000 |
| Overall | 50 | 150 | 500 | 1,800 | 9,000 |
Note: Among adults who lost money, before any recovery, because of non-credit card-related fraud. Results exclude the five respondents who reported recovering more money than they lost and one respondent who reported losing $5 million.
A variety of payments instruments were involved with fraud and scams.57 Excluding credit cards, the two most common were debit cards—consistent with debit cards being among the most widely used payment methods—and peer-to-peer (P2P) payment services (table 37).58 Other payment instruments were much less commonly involved, likely reflecting their lower use as payment methods overall. Cash, as the most widely used payment method, is one exception. Though cash's lack of involvement with fraud may reflect its in-person, physical nature.59
Table 37. Payment method involved in non-credit card fraud
| Payment method | Percent |
|---|---|
| Debit card | 41 |
| Peer-to-peer payments (such as Zelle, PayPal, Venmo, CashApp, or Apple Cash) | 29 |
| Bank wire or other electronic transfer | 13 |
| Cryptocurrency | 9 |
| Prepaid, gift, or government benefit card | 7 |
| Cash | 6 |
| Personal check | 6 |
| Money transfer service (such as Western Union, MoneyGram, or Ria) | 4 |
| Cashier's check or money order | 3 |
| Other | 19 |
Note: Among adults who experienced non-credit card-related fraud. Respondents could select multiple answers.
While fraud involving cryptocurrency was less common than fraud involving debit cards, the likelihood of losing money was typically much higher. At 65 percent, adults experiencing fraud involving cryptocurrency were the most likely to have lost money that was not recovered, roughly double the 31 percent for those experiencing fraud involving debit cards.60 In between those were P2P payment services and bank wire or electronic transfer. About half (52 percent) of adults who experienced fraud involving P2P payment services lost money that was not recovered, while this was the case for nearly 40 percent of those whose fraud involved a bank wire or other electronic transfer.61
The dollar amount lost also varied by payment method. Fraud involving cryptocurrency and bank wires or other electronic transfers often involved larger dollar amounts, whereas fraud involving debit cards and P2P payment services tended toward smaller dollar amounts (table 38).62
Table 38. Amount of money lost to fraud (by payment method)
Dollars
| Payment method | Amount lost before any recovery, median | Amount lost after any recovery, median |
|---|---|---|
| Debit card | 300 | 0 |
| Peer-to-peer payments (such as Zelle, PayPal, Venmo, CashApp, or Apple Cash) | 500 | 200 |
| Bank wire or other electronic transfer | 2,000 | 100 |
| Cryptocurrency | 1,200 | 900 |
| Overall | 500 | 30 |
Note: Among adults who lost money, before any recovery, because of non-credit-card-related fraud. Estimates exclude five respondents who reported recovering more money than they lost and one respondent who reported losing $5 million. Payment methods without a large enough sample are not shown.
People took a variety of actions in response to the fraud. Just above two-thirds of adults experiencing non-credit card fraud said they communicated with their bank or financial services company for assistance in dealing with the fraud, while 12 percent said they changed the banks or financial service companies that they use. Nearly 4 in 10 reported the fraud to law enforcement, a credit bureau, or a government agency that deals with consumer concerns/complaints.
References
48. Cryptocurrencies are decentralized digital assets that have a distributed ledger and can be used for peer-to-peer payments. For additional information on cryptocurrencies, see Board of Governors of the Federal Reserve System, Money and Payments: The U.S. Dollar in the Age of Digital Transformation (Washington: Board of Governors, January 2022), https://www.federalreserve.gov/publications/money-and-payments-discussion-paper.htm. Return to text
49. Because the survey is conducted online, the sample population may be more technologically connected than the overall population, which could increase the share of adults reporting use of emerging technologies such as cryptocurrencies. Return to text
50. While only a small share of adults used cryptocurrency to send money to friends or family, the survey asked those who did if the recipient was outside of the United States. In 2025, one-third of adults who used cryptocurrency to send money to friends or family indicated that at least one transfer was made internationally. Return to text
51. Consumer Sentinel Network Databook, Federal Trade Commission, 2024, https://www.ftc.gov/system/files/ftc_gov/pdf/csn-annual-data-book-2024.pdf. Return to text
52. See the Federal Bureau of Investigation website at https://www.fbi.gov/how-we-can-help-you/scams-and-safety/common-frauds-and-scams. Return to text
53. See table 40 in the "Credit" section of this report for credit card ownership rates by income and age. Return to text
54. Estimates are among those who know whether they lost money. Return to text
55. These estimates are weighted to reflect the total U.S. population. Respondents were asked about the most recent fraud they experienced, so those experiencing multiple incidents of fraud may have had additional losses. Consumers reported $12.5 billion in losses in 2024 according to the Consumer Sentinel Network, a database containing fraud reports filed by consumers, available at https://www.ftc.gov/system/files/ftc_gov/pdf/csn-annual-data-book-2024.pdf. In 2023, reported losses totaled $10 billion, and after accounting for underreporting, the estimated range of total losses was $24 billion to $158 billion. See Federal Trade Commission (FTC), Protecting Older Consumers, 2023–2024 (Washington: FTC, October 2024), https://www.ftc.gov/system/files/ftc_gov/pdf/federal-trade-commission-protecting-older-adults-report_102024.pdf. Return to text
56. Among those adults who did not recover all their money, the median amount lost and not recovered was $500, and the 75th percentile was $2,000. Return to text
57. While financial fraud and scams can take many forms, the survey does not separate the methods used by scammers to access funds. The techniques used by scammers can affect the relative incidence of fraud across payment methods. See Fumiko Hayashi and Ying Lei Toh, "Contact and Payment Methods Used for the Top Five Categories of Scams," Payment System Research Briefing (Kansas City: Federal Reserve Bank of Kansas City, September 2025), https://www.kansascityfed.org/research/payments-system-research-briefings/contact-and-payment-methods-used-for-the-top-five-categories-of-scams/). Return to text
58. Peer-to-peer (P2P) payment services allow consumers to transfer money electronically, often by using a mobile app. The survey included examples of these services for respondents, including PayPal, Venmo, Cash App, and Zelle. Return to text
59. According to the Diary of Consumer Payment Choice, the top three payment methods were cash, credit card, and debit card. Eighty-three percent of adults made a payment with cash in the past month, 72 percent made a payment with a credit card, and 67 percent made a payment with a debit card. Less common methods included checks (35 percent), prepaid cards (20 percent) and money orders (5 percent). Cryptocurrency was the lowest at 0.3 percent. Kevin Foster, Claire Greene, and Joanna Stavins, "2024 Survey and Diary of Consumer Payment Choice: Summary Results" (Federal Reserve Bank of Atlanta, 2025), https://www.atlantafed.org/research-and-data/surveys/survey-and-diary-of-consumer-payment-choice. Return to text
60. Because respondents could select more than one payment method, loss and recovery estimates may reflect a combination of payment methods. That said, most respondents selected just one payment method (75 percent). Seventeen percent selected two methods, and 8 percent selected three or more. Return to text
61. Debit card, P2P payment services, bank wire or other electronic transfer, and cryptocurrency were the only payment methods with a large enough sample to provide estimates for the likelihood of losing money and the dollar amounts lost. Return to text
62. These results are generally consistent with findings based on the fraud reports received by the Federal Trade Commission (FTC). See Fumiko Hayashi and Ying Lei Toh, "Contact and Payment Methods Used for the Top Five Categories of Scams," https://www.kansascityfed.org/research/payments-system-research-briefings/contact-and-payment-methods-used-for-the-top-five-categories-of-scams/). Return to text