


Housing
Housing represents the largest expense for most families, and consequently, housing decisions have the potential to substantially affect economic outcomes. Housing costs and availability were a challenge for many adults, particularly those with low income. While rental costs held steady over the prior year, renters were more likely to have fallen behind on rent in 2025. Among homeowners, the cost of homeowners insurance contributed to some going without coverage entirely or having less coverage than they wanted. Many homeowners with insurance said that the costs have gone up by more than they were expecting in recent years.
Homeownership
Sixty-three percent of adults owned their home, while 27 percent rented.73 Homeownership rates varied substantially by income. Thirty-three percent of adults with less than $50,000 of income owned their home, compared with 86 percent of adults with an income of $100,000 or more.
The income gap in homeownership was even greater among adults under age 60, where the homeownership rate among those with income over $100,000 was more than three times that of those with income less than $50,000. One reason for this pattern may be that older adults, having already purchased their home during their working years, are now less reliant on income for homeownership.74 Another factor could be that increases in home prices have outpaced increases in income, making it more difficult for lower-income younger adults to afford homes than was the case for older generations.75
Gaps in homeownership rates were also apparent by other demographic characteristics. Black and Hispanic adults were less likely to own, and more likely to rent, than White and Asian adults. Adults with a disability were also less likely to own and more likely to rent their home (table 45).
Table 45. Homeownership and rental rates (by demographic characteristic)
Percent
| Characteristic | Own | Rent |
|---|---|---|
| Family income | ||
| Less than $25,000 | 24 | 45 |
| $25,000–$49,999 | 44 | 44 |
| $50,000–$99,999 | 66 | 29 |
| $100,000 or more | 86 | 12 |
| Age | ||
| 18–29 | 24 | 44 |
| 30–44 | 58 | 36 |
| 45–59 | 76 | 22 |
| 60+ | 83 | 14 |
| Race/ethnicity | ||
| White | 72 | 20 |
| Black | 44 | 43 |
| Hispanic | 48 | 41 |
| Asian | 66 | 25 |
| Disability status | ||
| Disability | 55 | 36 |
| No disability | 67 | 24 |
| Overall | 63 | 27 |
Note: Among all adults. The share who own plus the share who rent does not sum to 100 percent because some people live rent free in a house that neither they nor their spouse or partner own.
Cost of Housing
Sixty-four percent of adults who owned their home had a mortgage in 2025. The median monthly mortgage payment was $1,600, up from $1,500 in 2024.76 Likely reflecting differences in home prices across the country, mortgage payments were higher in the Northeast and West, compared with the Midwest and South (table 46). Consistent with increases in home prices and mortgage rates in recent years, mortgage payments were also larger among those who moved in 2024 or 2025 relative to those who moved into their homes in earlier years.77
Table 46. Median monthly mortgage payment (by census region and most recent move)
Dollars
| Census region | Moved in 2024 or 2025 | Overall |
|---|---|---|
| Northeast | 2,800 | 1,669 |
| Midwest | 1,800 | 1,350 |
| South | 2,250 | 1,550 |
| West | 2,950 | 1,975 |
| Overall | 2,300 | 1,600 |
Note: Among homeowners who reported a positive monthly mortgage payment. Owners with a mortgage were asked for the total mortgage payment that they sent to their mortgage servicer.
Among renters, the median reported rent held steady at $1,200 but remained up from $1,100 in 2023.
Like homeowners with a mortgage, renters in the Northeast and West had higher monthly rent payments compared with those in the Midwest and South, as measured by the median rental payment in the region (table 47). However, the median monthly rental payments were smaller than monthly mortgage payments made by homeowners. Renters who moved in 2024 or 2025 also had higher rent payments compared with those who did not move in the prior two years.78 The median rent for tenants who recently moved also held steady relative to that in the prior year.
Table 47. Median monthly rent payment (by census region and most recent move)
Dollars
| Census region | Moved in 2024 or 2025 | Overall |
|---|---|---|
| Northeast | 1,500 | 1,375 |
| Midwest | 1,070 | 915 |
| South | 1,300 | 1,100 |
| West | 1,750 | 1,450 |
| Overall | 1,300 | 1,200 |
Note: Among renters who reported a positive monthly rent payment.
Renter Experiences
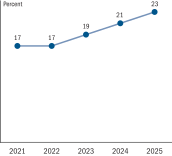
Challenges paying rent increased compared with the prior year. Twenty-three percent of renters reported that they had been behind on their rent at some point in the past year, up 2 percentage points from 2024 and 6 percentage points since 2021 when pandemic-era protections for renters were in place (figure 36).
Figure 36. Behind on rent at some point in past year
Accessible Version | Return to text
Note: Among renters.
Lower-income renters were more likely to fall behind on rent than higher-income renters. Nearly one-third of renters with less than $50,000 in income reported being behind on rent at some point during the past year, compared with 5 percent among renters with income of at least $100,000 (table 48).
Table 48. Behind on rent at some point in the past year (by income and year)
Percent
| Family income | 2023 | 2024 | 2025 |
|---|---|---|---|
| Less than $25,000 | 27 | 31 | 33 |
| $25,000–$49,999 | 26 | 25 | 31 |
| $50,000–$99,999 | 14 | 16 | 17 |
| $100,000 or more | 2 | 6 | 5 |
| Overall | 19 | 21 | 23 |
Note: Among renters. Income is not comparable prior to 2023 because of changes to question wording.
The share of lower-income renters behind on rent also went up compared with a year prior but held steady among higher-income renters. That said, the share behind on rent has increased among renters of all incomes since 2023.
Rent payments, despite being a large monthly expenditure, aren't typically reported to credit bureaus like mortgage payments are. That said, while still uncommon, reporting of rent payments has been increasing in recent years.79 In 2025, 8 percent of renters had their payments reported to one of the three national credit bureaus.
Black renters were among the most likely to have their rent payments reported, at 13 percent. Renters who had fallen behind on their rent in the past year had their rent payments reported to a credit bureau at similar rates to those who had not fallen behind (9 percent and 8 percent, respectively).
Some renters face eviction for a variety of reasons, including nonpayment of rent, and ultimately move from their home. In 2025, 2 percent of renters moved in the prior year because of eviction or threat of eviction, similar to the prior year. This represents 16 percent of renters who moved during 2025.
Homeowners Insurance
Overall, 6 percent of all homeowners went without homeowners insurance.80 This rate was nearly unchanged from that in 2024.
As an indication of the need for insurance, 14 percent of adults reported being financially affected by natural disasters or severe weather events in the year before the survey (such as flooding, hurricanes, wildfires, or extreme temperatures).81 When asked about how they were affected, the most common way was property damage, with 8 percent of adults affected.
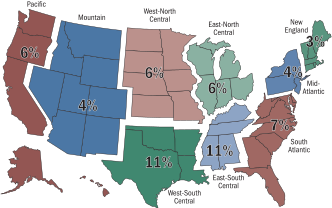
Rates of homeowners insurance varied substantially across the country. The share of homeowners going without homeowners insurance was lowest in New England and highest in the East-South Central and West-South Central divisions (figure 37).82 Additionally, homeowners living in low- or moderate-income neighborhoods were more likely to go without homeowners insurance (12 percent), compared with those living in high-income neighborhoods (5 percent).
Figure 37. Share with no homeowners insurance on primary residence (by census division)
Accessible Version | Return to text
Note: Among all homeowners.
Homeowners with fewer financial resources were among the most likely to go without homeowners insurance. For example, roughly 2 in 10 homeowners with income less than $50,000, as well as 3 in 10 homeowners whose only asset was their home, went without homeowners insurance.
A majority of those who went without homeowners insurance did so because of cost. When asked the main reason they did not have homeowners insurance, 43 percent said they "couldn't afford it," while another 16 percent said "it is not worth the cost." Fifteen percent said "I self-insure or prefer not to buy insurance," and 8 percent said that "no insurance company will insure my home."
The cost of homeowners insurance was also a challenge for some homeowners with insurance, particularly those with lower incomes. Twenty percent of insured homeowners said they "would prefer more coverage but can't afford it," and 14 percent said that they "struggle to afford the premiums." Among insured homeowners with income less than $50,000, 33 percent preferred more coverage but couldn't afford it, while nearly 30 percent struggled to afford the premiums. More than 6 in 10 insured homeowners, regardless of income, said that the cost of homeowners insurance "had gone up by more than they were expecting in recent years."
References
73. Nine percent of adults reported neither owning nor renting. Sixty-eight percent of those who neither own nor rent are under age 30. Similarly, 68 percent of those who neither own nor rent live with their parents. Return to text
74. Further, older adults, even those with lower income, are much more likely to own their homes free and clear. For example, among adults with income less than $50,000, 39 percent of those age 60 or older owed their home free and clear, compared with 10 percent of those under age 60. Return to text
75. Peyton Whitney, "Home Prices Surge to Five Times Median Income, Nearing Historic Highs," Joint Center for Housing Studies (Cambridge: Harvard University, October 6, 2025), https://www.jchs.harvard.edu/blog/home-prices-surge-five-times-median-income-nearing-historic-highs. Return to text
76. Owners with a mortgage were asked for the total mortgage payment that they send to their bank, which will typically include escrow payments for taxes and homeowners insurance but will not include utilities. Return to text
77. Although mortgage interest rates were down from their 2023 peak, they remained well above rates from 2010–21. For details on average mortgage rates over time, see Freddie Mac, "Current Mortgage Rate Data Since 1971," https://www.freddiemac.com/pmms. For details on median home prices over time, see "Median Sales Price of Houses Sold for the United States," https://fred.stlouisfed.org/series/MSPUS. Return to text
78. In addition to reflecting changes in rent prices over time for new leases, the differences in rent prices for those who moved recently may reflect differences in who decides to move each year. Return to text
79. Daniel Teles, Brett Theodos, and Amanda Hermans, The Rise of Rent Reporting as a Credit-Building Tool (Washington: Urban Institute, November 2025), https://www.urban.org/sites/default/files/2025-11/The_Rise_of_Rent_Reporting_as_a_Credit-Building_Tool.pdf. Return to text
80. Homeowners with a mortgage generally are required to have homeowners insurance, and only 3 percent reported not having it. Thirteen percent of owners who own their home free and clear went without homeowners insurance, unchanged from 2024. Return to text
81. In 2024, 21 percent were financially affected by a natural disaster or sever weather. A possible contributing factor to this decline was that no hurricanes made landfall in the continental U.S. for the first time since 2015. See the National Oceanic and Atmospheric Administration, "2025 Atlantic Hurricane Season Marked by Striking Contrasts," https://www.noaa.gov/news-release/2025-atlantic-hurricane-season-marked-by-striking-contrasts. Moreover, geographic regions that are typically affected by hurricanes saw the largest percentage-point drop in the share of adults who reported being financially affected by a natural disaster. Return to text
82. Census divisions are used because the sample contains too few observations to provide estimates for each state. Census divisions are groupings of states that subdivide the United States. See the U.S. Census Bureau at https://www.census.gov/programs-surveys/economic-census/guidance-geographies/levels.html. Geographic differences remain when looking only among homeowners who own their homes free and clear. Return to text