


Credit
Individuals use credit products for many reasons, including paying for everyday purchases, financing higher education, or helping cover periods of income variability. Credit card ownership rates and repayment behavior were similar to prior years. Lower-income and Black and Hispanic adults were more likely to use alternative forms of credit, including Buy Now, Pay Later (BNPL) and small-dollar credit products. A majority of adults were very confident that they could access additional credit if they were to apply.
Credit Outcomes and Perceptions
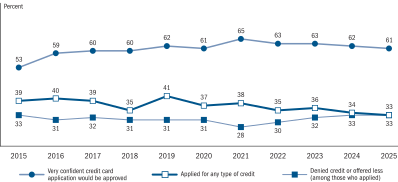
Consumer credit confidence has fallen since 2021, when both credit confidence and self-reported financial well-being was at the highest level since the survey began (see the "Overall Financial Well-Being" section of this report). Sixty-one percent of adults in 2025 felt very confident their credit card application would be approved, if they were to apply, down from 65 percent in 2021 (figure 30).
Figure 30. Credit outcomes and perceptions (by year)
Accessible Version | Return to text
Note: Among all adults.
Fewer adults applied for credit in 2025 than in any year since 2015, the first time the survey asked about credit application outcomes. Thirty-three percent of adults applied for any type of credit in 2025. Among those who applied, one-third were either denied credit or approved for less credit than they requested, up 5 percentage points from 2021, but unchanged from the prior year (figure 30).
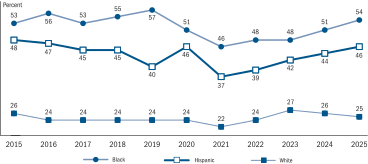
Denial rates continued to differ substantially by race and ethnicity. Black and Hispanic applicants were particularly likely to report a denial or be approved for less credit than requested, despite applying for credit at similar rates as White and Asian borrowers.63 In 2025, the 54 percent denial rate for Black applicants was more than twice the denial rate for White applicants. Moreover, the significant racial and ethnic gap in denial rates has largely persisted for over a decade (figure 31). After declining during the early years of the pandemic, by 2025 the racial and ethnic gaps had reverted to their 2018 magnitudes.
Figure 31. Denied credit or approved for less than was requested (by year and race/ethnicity)
Accessible Version | Return to text
Note: Among adults who applied for credit.
Consumers who have difficulty accessing credit sometimes turn to alternative nonbank small dollar credit products, like payday or pawn loans, when a small dollar credit need arises.64 Additionally, consumers lacking any credit history, or those who are not confident they would be approved for traditional kinds of credit, may turn to these products when they need credit. These products typically have high borrowing costs.65
In 2025, 7 percent of adults used a payday, pawn, auto title, or tax refund anticipation loan, up 1 percentage point from the prior year. While overall use tends to be low, use is higher among adults with lower income, Black and Hispanic adults, adults with a disability, and adults living in low- and moderate-income neighborhoods (table 39).
Table 39. Use of payday, pawn, auto title, and refund anticipation loans (by demographic characteristics)
| Characteristic | Percent |
|---|---|
| Family income | |
| Less than $25,000 | 13 |
| $25,000–$49,999 | 14 |
| $50,000–$99,999 | 6 |
| $100,000 or more | 2 |
| Age | |
| 18–29 | 9 |
| 30–44 | 10 |
| 45–59 | 7 |
| 60+ | 2 |
| Race/ethnicity | |
| White | 4 |
| Black | 15 |
| Hispanic | 11 |
| Asian | 3 |
| Disability status | |
| Disability | 12 |
| No disability | 5 |
| Neighborhood income | |
| Low or moderate income | 12 |
| Middle or upper income | 4 |
| Overall | 7 |
Note: Among all adults.
Credit Cards
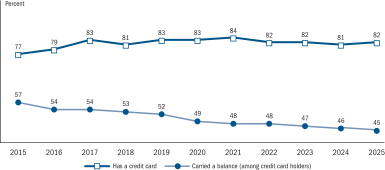
Eighty-two percent of adults had a credit card in 2025, compared to a high of 84 percent in 2021 (figure 32). Yet, how people use their cards vary. Some people use credit cards primarily to make payments, paying off their balances in full each month and avoiding interest charges. Others carry a balance and incur borrowing costs. In 2025, 45 percent of credit card owners said they carried a balance at least once during the prior 12 months, down 12 percentage points over the past decade (figure 32).66
Figure 32. Credit card ownership and usage (by year)
Accessible Version | Return to text
Note: Among all adults. "Carried a balance" reflects the share who carried a balance at least once in the past year.
Almost all adults with an income of $100,000 or more had a credit card. As incomes decline, having a credit card was less common.
Carrying a balance, on the other hand, is more common among card holders with lower incomes. Slightly over half of card holders with income under $100,000 carried balances from month to month, exceeding that seen among higher-income cardholders. Taken together with the rates of card ownership by income, middle-income adults were the most likely to have a credit card that they used to finance purchases by carrying balances from one month to the next (table 40). Carrying a balance was also particularly common among Black and Hispanic adults.
Table 40. Credit card ownership and usage (by demographic characteristics)
Percent
| Characteristic | Has a credit card | Carried a balance (among credit card holders) | Carried a balance (among all adults) |
|---|---|---|---|
| Family income | |||
| Less than $25,000 | 46 | 52 | 24 |
| $25,000–$49,999 | 71 | 57 | 41 |
| $50,000–$99,999 | 88 | 50 | 44 |
| $100,000 or more | 97 | 37 | 36 |
| Age | |||
| 18–29 | 65 | 46 | 30 |
| 30–44 | 78 | 50 | 39 |
| 45–59 | 86 | 52 | 45 |
| 60+ | 92 | 36 | 33 |
| Race/ethnicity | |||
| White | 87 | 40 | 34 |
| Black | 68 | 72 | 48 |
| Hispanic | 72 | 58 | 41 |
| Asian | 90 | 24 | 22 |
| Disability status | |||
| Disability | 70 | 55 | 38 |
| No disability | 85 | 43 | 36 |
| Overall | 82 | 45 | 37 |
Note: Among all adults. "Carried a balance" reflects the share who carried a balance at least once in the past year.
Although the SHED does not ask respondents about the amount of their credit card balances, data that links SHED responses to credit data can provide insights into usage patterns. For more information about credit balances, and how average balances have changed in recent years, see box 1.
Box 1. Financial Well-Being of Adults with Increasing Credit Card Balances
The credit records maintained by nationwide credit reporting agencies are an important source of information about consumer credit, forming the basis for billions of credit decisions each year. In the 2025 SHED, 63 percent of respondents agreed to have their responses matched to information from their credit reports.1 These credit data provide additional context for survey responses that shed light on credit market developments.
The Federal Reserve Bank of New York's Household Debt and Credit Report for 2025:Q3 reports that aggregate credit card balances reached $1.2 trillion, an all-time high and an increase of 14 percent over the previous two years. By themselves, higher credit card balances can be hard to interpret. They could reflect additional spending driven by higher income or improving financial conditions. Or, they could indicate that borrowers are having a harder time making ends meet, paying for more expenses with credit, or having difficulty repaying debt. The SHED data linked to credit records can provide insights into this question.
Survey responses linked to credit data from the SHED suggest that most of the increase in credit card balances over the prior two years reflects increases among those facing financial hardships. Compared with two years earlier, the average credit card balances of SHED respondents with credit cards increased $748 (11 percent) in the previous two years (table A). Balance increases were much smaller $59 (1 percent) among those who reported they were "living comfortably." In contrast, average balances increased by over $2,500 (37 percent) among borrowers who were "finding it difficult to get by."
Table A. Average credit card balance (by financial well-being in 2025)
Dollars
| Financial well-being | 2023 Balance | 2025 Balance | Balance change 2023–25 |
|---|---|---|---|
| Finding it difficult to get by | 6,735 | 9,265 | 2,530 |
| Just getting by | 6,782 | 8,581 | 1,799 |
| Doing okay | 6,668 | 7,308 | 640 |
| Living comfortably | 6,248 | 6,307 | 59 |
| Overall | 6,531 | 7,279 | 748 |
Note: Among respondents who consented to merging credit data to survey responses. Balances in 2023 reflect the balances for the same 2025 respondents two years earlier.
The general trend of credit card balances increasing more rapidly among those facing financial hardships is not new. A similar pattern was observed for each of the last two years of the SHED. However, the extent to which credit card balance growth has been concentrated among those with financial hardships is new. In the prior surveys, those "living comfortably" accounted for about one-fourth of the growth in credit card balances over the prior two years, compared to just 3 percent in the 2025 survey. Those "finding it difficult to get by" or "just getting by," combined, accounted for 65 percent of credit card balance growth in the 2025 survey, but they accounted for only 40 percent of balance growth in the 2023 and 2024 surveys.
1. The matched data received by the Federal Reserve does not include any information that directly identifies a respondent (such as name, address, or account numbers). Return to text
Buy Now, Pay Later
Buy Now, Pay Later is a deferred payment product that provides consumers the option to pay for a purchase with a small number of equal payments (usually four), often without being charged interest. For example, someone purchasing a $100 item may be able to make one payment of $25 at the time of purchase, then make three additional biweekly payments of $25.
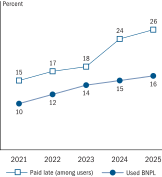
Sixteen percent of people used BNPL in the prior 12 months, up from 15 percent in 2025 and 10 percent in 2021, when the survey first asked about BNPL (figure 33).
Figure 33. Use of Buy Now, Pay Later (BNPL)
Accessible Version | Return to text
Note: Among all adults.
Use of BNPL was more common among adults making less than $100,000 a year. Black and Hispanic adults, women, and adults under age 60 were also more likely to use BNPL (table 41). Differences by race and ethnicity were large, with Black and Hispanic adults being more than twice as likely to use BNPL as White or Asian adults. Additionally, sizeable differences remain even after controlling for other factors like income and age.
Table 41. Buy Now, Pay Later (BNPL) use (by demographic characteristics)
Percent
| Characteristic | Used BNPL | Paid late (among users) |
|---|---|---|
| Family income | ||
| Less than $25,000 | 18 | 40 |
| $25,000–$49,999 | 23 | 33 |
| $50,000–$99,999 | 18 | 25 |
| $100,000 or more | 12 | 11 |
| Age | ||
| 18–29 | 22 | 32 |
| 30–44 | 21 | 31 |
| 45–59 | 17 | 22 |
| 60+ | 9 | 12 |
| Race/ethnicity | ||
| White | 12 | 21 |
| Black | 29 | 32 |
| Hispanic | 26 | 26 |
| Asian | 11 | 16 |
| Male/female | ||
| Male | 14 | 23 |
| Female | 19 | 27 |
| Overall | 16 | 26 |
Note: Among all adults.
Slightly more than one-fourth of BNPL users were late making a payment, essentially unchanged from the prior year (table 41). Younger BNPL users and those with an income less than $50,000 were more likely to make payments late. Sixty-four percent of those BNPL users who were late making a payment (17 percent of those who used BNPL) said they were charged extra for being late.
Since most consumers need to enroll in automatic payments in order to use BNPL, many payments are made via autopay with a checking account. This poses an additional risk of overdraft fees for BNPL consumers. Eleven percent of adults who used BNPL had a payment trigger an overdraft or non-sufficient funds (NSF) fee from their bank in the prior year. Among BNPL users who said they were charged extra for paying late, nearly 4 in 10 (38 percent) experienced an overdraft or an NSF fee triggered by a BNPL payment.
The 2025 survey asked BNPL users for the main reason that they paid for a purchase in this way.67 The most important reasons for using BNPL were wanting to spread out payments, and because it was the only way to afford the purchase (table 42).
Table 42. Main reason for using Buy Now, Pay Later (BNPL) (by family income)
Percent
| Reason | Less than $25,000 | $25,000–$49,999 | $50,000–$99,999 | $100,000 or more | Overall |
|---|---|---|---|---|---|
| Wanted to spread out payments | 25 | 27 | 31 | 38 | 31 |
| Only way I could afford it | 40 | 37 | 32 | 15 | 29 |
| Avoid interest charges | 9 | 11 | 13 | 26 | 16 |
| Convenience | 13 | 14 | 12 | 12 | 12 |
| Did not want to use a credit card | 2 | 3 | 5 | 6 | 4 |
| Wanted a fixed number of payments | 3 | 4 | 2 | 1 | 2 |
| Only accepted payment method I had | 2 | 1 | 1 | 1 | 1 |
Note: Among adults who have used BNPL in the past year.
BNPL consumers' main reasons for using the product differed by income. Low-income users most commonly said that they used BNPL because it was the only way that they could afford the purchase. In contrast, high-income users with income of $100,000 or more most commonly said that they wanted to spread out payments or avoid interest charges (table 42).
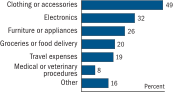
Nearly half of BNPL users said that they bought clothing and accessories with the product at least once in the prior year (figure 34). Electronics and furniture or appliances were also commonly purchased using BNPL. One in five BNPL users used the product to pay for groceries or food delivery in the prior year.
Figure 34. Types of purchases made using Buy Now, Pay Later (BNPL)
Accessible Version | Return to text
Note: Among adults who have used BNPL in the past year.
Some consumers appear to be using BNPL for basic needs when faced with affordability challenges. Forty-five percent of those who used BNPL for grocery or food delivery purchases said that the main reason for using BNPL is that it was way the only way that they could afford a purchase.
The survey results also indicated that there are opportunities to better inform BNPL users about how the product affects their credit. At the time of the survey, BNPL purchases and on time payments would not affect credit histories or credit scores with any of the three major credit bureaus.68 Yet 38 percent agreed with the statement (and an additional 40 percent were unsure) that using the product would help build a credit history. Similarly, a majority of BNPL users (53 percent) incorrectly agreed with the statement that making on time payments helps their credit score. Overall, only 14 percent of BNPL users answered both questions correctly, suggesting that most users do not fully understand the credit implications of the financial product.
Student Loans
Consumers use student loans to finance higher education for themselves or members of their family. Sixteen percent of all adults had outstanding student loans in 2025.69 Among those who attended at least some college, 21 percent had outstanding loans.70 Younger adults, Black adults, and women were more likely to have student loans (table 43). In contrast, having student loans did not vary by income.
Table 43. Share with student loans (by demographic characteristics)
| Characteristic | Percent |
|---|---|
| Family income | |
| Less than $25,000 | 16 |
| $25,000–$49,999 | 16 |
| $50,000–$99,999 | 16 |
| $100,000 or more | 15 |
| Age | |
| 18–29 | 25 |
| 30–44 | 22 |
| 45–59 | 15 |
| 60+ | 5 |
| Race/ethnicity | |
| White | 14 |
| Black | 28 |
| Hispanic | 15 |
| Asian | 12 |
| Male/female | |
| Male | 13 |
| Female | 18 |
| Overall | 16 |
Note: Among all adults.
Borrowers with federal student loans experienced a long forbearance period following the COVID-19 pandemic. Most of these forbearance policies were no longer in place in 2025.71 Nevertheless, many student loan borrowers are not currently required to make payments because of deferment while in school, forbearance for economic hardships, or having a low income while on an income driven repayment plan.72 Forty-five percent of borrowers indicated that they were not currently required to make student loan payments at the time of the survey.
Additionally, slightly less than three-fourths of adults who were required to make a payment on their student loans paid the full amount in the month prior to the survey. Falling behind on payments was closely tied to one's income. Less than half of low-income borrowers with an income under $50,000 per year paid the required amount, compared with 92 percent of borrowers with an income of $100,000 or more who did so (table 44). Black borrowers and female borrowers were also less likely to have made the full payment.
Table 44. Paid full required student loan payment in prior month (by demographic characteristics)
| Characteristic | Percent |
|---|---|
| Family income | |
| Less than $25,000 | 42 |
| $25,000–$49,999 | 47 |
| $50,000–$99,999 | 70 |
| $100,000 or more | 92 |
| Age | |
| 18–29 | 69 |
| 30–44 | 74 |
| 45–59 | 75 |
| 60+ | 79 |
| Race/ethnicity | |
| White | 83 |
| Black | 52 |
| Hispanic | 70 |
| Asian | 75 |
| Male/female | |
| Male | 80 |
| Female | 69 |
| Overall | 73 |
Note: Among adults with student loans who were required to make payments.
Even among borrowers who made their most recent student loan payment, some reported recent difficulties with their payments. In addition to asking respondents about their most recent payment, the survey asked whether they had difficulty paying their student loan in the past 12 months. Fourteen percent of borrowers who were required to make payments said that they made the prior month's payment but had difficulty within the past year. Hence, a total of 41 percent of those required to make payments (23 percent of adults with student loan debt) recently had payment difficulties.
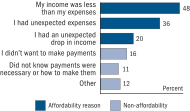
Insufficient income and unexpected expenses made student loan repayment difficult for some borrowers. Slightly less than half of student loan borrowers who experienced difficulty repaying their loans said it was due, in part, to their income being less than their expenses (figure 35). Collectively, 76 percent of borrowers who experienced difficulty repaying their loans had an affordability challenge—their income was less than their expenses, they had unexpected expenses, or they had an unexpected drop in income.
Figure 35. Reasons for experiencing repayment difficulty
Accessible Version | Return to text
Note: Among student loan borrowers experiencing repayment difficulty. Key identifies bars in order from top to bottom.
Reasons unrelated to affordability were less likely to cause repayment difficulty. Sixteen percent of borrowers experiencing repayment difficulty said it was due to not wanting to make payments. Perhaps because of borrower confusion following the four-year forbearance period, slightly more than 1 in 10 borrowers experiencing repayment difficulty did not know how to make payments or did not know that they needed to make payments.
References
63. Black and Hispanic adults saw higher denial rates even after controlling for other characteristics such as income and age. Return to text
64. Federal Deposit Insurance Corporation (FDIC), 2023 FDIC National Survey of Unbanked and Underbanked Households (November 2024). Return to text
65. Kevin Wack, "Five Reasons Why Small-Dollar Credit Is So Expensive," American Banker (July 30, 2013), https://www.americanbanker.com/news/five-reasons-why-small-dollar-credit-is-so-expensive. Return to text
66. Carrying a balance is also sometimes described as revolving a balance. Return to text
67. The 2025 SHED asked BNPL users for all reasons they used BNPL, and among those, to indicate the main reason for use. The main reason is reported in this section. Previous years of the survey did not ask about the main reason, and report on all reasons for use. A substantial difference between the "main reason" and "all reasons" is that many users said that they used it in part for convenience, but this was rarely the main reason to use BNPL. Results using any reason, which are comparable to prior years, are available in appendix B. Return to text
68. At the time of the survey, most BNPL providers were not reporting loans to credit bureaus. Even if loans were reported, they did not factor into scores and were not visible to any lenders (Affirm, "People Deserve Credit for Managing Their Money Responsibly," press release, November 25, 2025, https://investors.affirm.com/news-releases/news-release-details/people-deserve-credit-managing-their-money-responsibly). Return to text
69. Eighty-one percent of adults with student loans held debt for their own education. Twenty-eight percent of adults had student loan debt due to financing their child's or grandchild's education. Return to text
70. Five percent of adults with a high school degree or less had student loans (for their own or someone else's education). Individuals who enroll and take out loans for educational programs beyond high school but do not attend or only attend a portion of the program will be responsible for the debt they took out, but do not have a certificate or degree. This statistic is among those who currently have student loans, for information about who has ever had student loans see Board of Governors of the Federal Reserve System, Economic Well-Being of U.S. Households in 2024 (Washington: Board of Governors, May 2025), https://doi.org/10.17016/8960.1. Return to text
71. Delinquent student loans began to be reported to credit bureaus in late 2024. For information on student loan credit reporting, see Liberty Street Economics, "Student Loan Delinquencies Are Back, and Credit Scores Take a Tumble," at https://libertystreeteconomics.newyorkfed.org/2025/05/student-loan-delinquencies-are-back-and-credit-scores-take-a-tumble/. Return to text
72. For additional details on circumstances when borrowers can get a deferment or forbearance, see https://studentaid.gov/manage-loans/lower-payments/get-temporary-relief. Return to text