


Overall Financial Well-Being
The share of adults doing okay financially or living comfortably held steady in 2025, though several demographic groups, including low-income, young, and Black adults, reported meaningful declines.2 Price increases remained the most common financial concern. Concerns about finding or keeping a job were less common but increased compared with 2024. Favorable perceptions of people's local economy and the national economy declined over the prior year and remained much lower than in 2019, before the pandemic.
Current Financial Situation
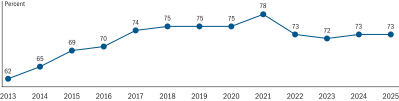
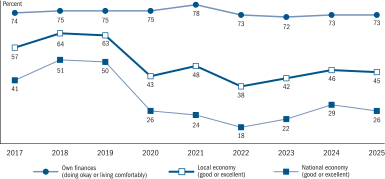
Near the end of 2025, 73 percent of adults reported "doing okay" financially (39 percent) or "living comfortably" (34 percent). The rest reported either "just getting by" (19 percent) or "finding it difficult to get by" (8 percent). The share of adults doing okay financially or living comfortably has remained at or near 73 percent since 2022, down from the previous plateau of 75 percent observed from 2018 to 2020 (figure 1).3
Figure 1. Doing okay or living comfortably financially (by year)
Accessible Version | Return to text
Note: Among all adults.
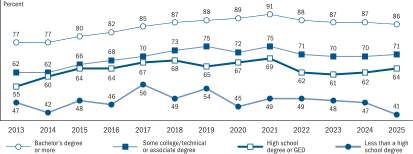
As in previous years, adults with at least a bachelor's degree continued to report higher financial well-being than did adults with lower levels of education. Eighty-six percent of adults with at least a bachelor's degree reported doing okay financially or living comfortably, compared with 41 percent of those with less than a high school degree.
The gap in well-being by education edged up, driven by a sharp decline among adults with less than a high school degree (figure 2).4 Further, well-being declined among both younger and older adults with less than a high school degree, indicating the decline for those with less than a high school degree was not driven solely by younger adults.
Figure 2. Doing okay or living comfortably financially (by year and education)
Accessible Version | Return to text
Note: Among all adults. Results differ slightly from previous reports because of adjustments to education coding.
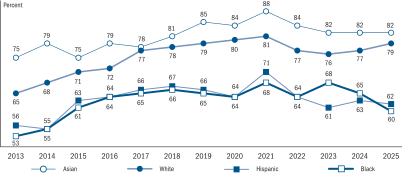
Differences in financial well-being across racial and ethnic groups also persisted in 2025. Eighty-two percent of Asian adults were doing okay or living comfortably, followed by 79 percent of White adults, 62 percent of Hispanic adults, and 60 percent of Black adults (figure 3).5
Figure 3. Doing okay or living comfortably financially (by year and race/ethnicity)
Accessible Version | Return to text
Note: Among all adults.
Black adults saw further declines in financial well-being, with the share doing okay or living comfortably down 5 percentage points from 2024.6 In contrast, the share doing okay or living comfortably was up among White adults and statistically indistinguishable from the prior year among Asian and Hispanic adults (figure 3).
Financial well-being continued to differ by several other dimensions, including income, age, disability status, metropolitan status, and neighborhood income designation (table 1).7 For instance, 63 percent of adults ages 18 to 29 reported doing okay or living comfortably, markedly lower than the 83 percent of adults age 60 or over who did so. This gap in well-being widened over the prior year, primarily driven by a decline in financial well-being among adults ages 18 to 24. This decline may reflect, at least in part, the more challenging job market facing young adults (see the "Employment and Job Quality" section of this report).
Table 1. Doing okay or living comfortably financially (by demographic characteristics)
Percent
| Characteristic | 2025 | 1-year change (since 2024) | Change since pre-pandemic (2019) |
|---|---|---|---|
| Family income | |||
| Less than $25,000 | 45 | −4 | n/a |
| $25,000–$49,999 | 55 | −1 | n/a |
| $50,000–$99,999 | 74 | 1 | n/a |
| $100,000 or more | 91 | 0 | n/a |
| Age | |||
| 18–29 | 63 | −3 | −4 |
| 30–44 | 68 | 1 | −4 |
| 45–59 | 74 | 3 | −1 |
| 60+ | 83 | −1 | −1 |
| Disability status | |||
| Disability | 56 | −2 | n/a |
| No disability | 78 | 1 | n/a |
| Metropolitan status | |||
| Metro area | 74 | 0 | −2 |
| Non-metro area | 67 | 1 | −5 |
| Neighborhood income | |||
| Low or moderate income | 59 | −2 | −4 |
| Middle or upper income | 79 | 1 | −1 |
| Overall | 73 | 0 | −2 |
Note: Among all adults. Income comparisons to 2019 are not shown because the income question changed in 2023. Disability status was first identifiable in the 2021 survey. Low- or moderate-income neighborhoods are defined here using the definition from the Community Reinvestment Act. Here and in subsequent tables and figures, percentages may not sum to 100 because of rounding.
n/a Not applicable.
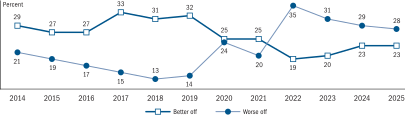
As a complement to the question asking how people are managing financially these days, the survey also asks respondents whether they are better or worse off financially than they were 12 months earlier. This question provides more insight into whether people's financial situation improved or worsened over the prior year, as some individuals may have felt worse off financially than they were a year earlier, for instance, even if they felt they were still doing okay overall (or that their financial well-being was improving even if they were still finding it difficult to get by overall).
Twenty-eight percent of adults said they were worse off financially than a year earlier, similar to the prior year and down from a series high of 35 percent in 2022. That said, the share doing worse off remains above the levels seen before the pandemic (figure 4). The share doing about the same as a year earlier ticked up to 49 percent, while the share who said they were better off held at 23 percent.
Figure 4. Financial situation compared with 12 months prior (by year)
Accessible Version | Return to text
Note: Among all adults.
Financial Challenges
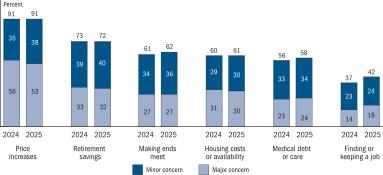
The survey further explored financial well-being by asking people about their financial challenges or concerns, including prices and jobs. "Price increases" remained the most common financial concern. Just above 9 in 10 adults said price increases were a "minor" or "major concern," unchanged from 2024 (figure 5). Price increases as a major concern did decline over this period, though generally remained flat among lower-income and younger adults.8
Figure 5. Financial challenges or concerns
Accessible Version | Return to text
Note: Among all adults. This question was only asked of a randomized half of the sample. "Student loans or education costs" not shown. Key identifies bars in order from top to bottom.
Lower-income and younger adults were also more likely to be concerned about price increases overall. For example, 66 percent of adults with income under $50,000 said that price increases were a major concern, compared with 42 percent among those with income over $100,000.
People's concerns about "finding or keeping a job" increased over the prior year, consistent with other indications of a solid but softening labor market (see the "Employment and Job Quality" section). Forty-two percent of adults said finding or keeping a job was either a minor or major concern, up from 37 percent in 2024 (figure 5). Increases in the share concerned about finding or keeping a job occurred among all income levels and ages.
That said, similar to demographic patterns in concerns about price increases, lower-income and younger adults were more likely to have these concerns overall. In 2025, adults with income less than $50,000 were nearly three times as likely as those with income of $50,000 or more to say finding or keeping a job was a major concern (30 percent versus 11 percent), and adults ages 18 to 29 were about twice as likely as those age 30 or older to say so (31 percent versus 14 percent).
Other concerns, like "retirement savings," "housing costs or availability," and "medical debt or care" generally remained at similar levels to 2024.
National and Local Economic Conditions
Along with questions about their own financial circumstances, people were asked to rate the national economy and their local economy as "excellent," "good," "only fair," or "poor." About one-fourth of adults rated the national economy good or excellent in 2025, down 3 percentage points over the prior year and well below the one-half of adults who did so in 2019, before the pandemic (figure 6).
Figure 6. Assessment of own financial well-being, local economy, and national economy (by year)
Accessible Version | Return to text
Note: Among all adults. The estimates for each of the series on the figure represent the two most favorable response choices. The four response options for own finances were "living comfortably," "doing okay," "just getting by," and "finding it difficult to get by." The response options for the local economy and the national economy were "good," "excellent," "fair," and "poor."
Overall, people's perceptions of their local economy were slightly less favorable in 2025. The 45 percent of people rating their local economy as good or excellent was down 1 percentage point from the prior year, yet still above the series low of 38 percent in 2022. However, changes in perceptions diverged sharply by metropolitan status. The share of adults rating their local economy as good or excellent fell 3 percentage points in metro areas yet rose 6 percentage points in non-metro areas.9 As a result, while people living in metro areas continued to rate their local economy more favorably than those in non-metro areas, this gap shrank considerably in 2025 (table 2).
Table 2. Self-assessment of local economy as good or excellent (by census region and metropolitan status)
Percent
| Characteristic | 2025 | 1-year change (since 2024) | Change since pre-pandemic (2019) |
|---|---|---|---|
| Census region | |||
| Northeast | 46 | −1 | −17 |
| Midwest | 48 | 0 | −16 |
| South | 44 | −1 | −20 |
| West | 41 | −4 | −20 |
| Metropolitan status | |||
| Metro area | 46 | −3 | −19 |
| Non-metro area | 37 | 6 | −16 |
| Overall | 45 | −1 | −18 |
Note: Among all adults.
References
2. Unless otherwise specified, results in this report are from the Federal Reserve's Survey of Household Economics and Decisionmaking. The survey was fielded in October 2025, and results reflect financial situations at that time. Results typically capture financial experiences at the time of the survey or in the 12-month period before the survey rather than the precise calendar year. Return to text
3. The share of adults "living comfortably" has also been stable since 2022 at around 34 percent each year. Return to text
4. The change from 2024 to 2025 in the share of adults doing okay or living comfortably was not statistically significant among the other three education groups: high school degree or GED, some college/technical or associate degree, and bachelor's degree or more. Return to text
5. The reported categorizations reflect the largest statistical groupings but are neither exhaustive nor the only distinctions important to understand. Sample sizes for other racial and ethnic groups and subpopulations are not large enough to produce reliable estimates. Additionally, results for Asian adults are sometimes excluded when the sample size is insufficient to provide a reliable estimate. Return to text
6. Black adults also exhibited evidence of worsening financial circumstances across other measures in the survey. For example, as shown in the "Income and Expenses" and "Employment and Job Quality" sections of this report, the share whose finances were harmed by price increases and the share who experienced layoffs were up over the prior year. Return to text
7. Income includes all cash income from all sources that respondents and their spouse or partner received during the previous year ("family income"). Disability status is based on a five-question functional limitation sequence that asks about hearing, vision, ambulatory, self-care, and independent living difficulties and is similar to the six-question sequence used for the American Community Survey (see U.S. Census Bureau, "How Disability Data Are Collected from the American Community Survey," https://www.census.gov/topics/health/disability/guidance/data-collection-acs.html). Metropolitan statistical area definitions follow the U.S. Census Bureau. For more details, see https://www.census.gov/programs-surveys/metro-micro/about.html. Neighborhood income uses the Community Reinvestment Act definition, where low- and moderate-income refers to communities that have a median family income of less than 80 percent of the area median income. For details on the definition, see Board of Governors of the Federal Reserve System, "Community Reinvestment Act (CRA) Resources," https://www.federalreserve.gov/consumerscommunities/cra_resources.htm. Return to text
8. One exception to these trends was among Black adults, where the 64 percent who said price increases were a major concern was up 6 percentage points from the prior year. These results on price increases as a main financial concern are broadly consistent with results from a separate question that asks people whether price changes had made their financial situation worse (see the "Income and Expenses" section of this report). Return to text
9. The divergence in perceptions among adults living in metro and non-metro areas may reflect, at least in part, their differing experiences with prices. For example, the share of adults who said they were worse off because of higher prices declined sharply among those living non-metro areas, while ticking down only slightly among those in metro areas (see the "Income and Expenses" section of this report). Return to text