


Income and Expenses
A majority of adults said that changes in prices they paid compared with the prior year had made their finances worse, but the share saying so declined compared with 2023 and 2024. The share of adults who said they always or often had money left over at the end of the month was essentially unchanged from 2024, suggesting that the share of adults who have margin in their family budgets has held steady over the past year.
Many young adults received help from someone outside their household to pay an expense in the prior 12 months. Money for a cell phone bill, for general expenses, and for housing costs—such as rent, mortgage, or utilities—were the most common forms of help that people received.
Sources of Income and Support
Although labor earnings were the most common source of income, many people had other sources of income as well. Sixty-eight percent of adults and their spouse or partner received wages, salaries, or self-employment income (collectively referred to here as "labor income") during the previous year (table 12). Fifty-seven percent of all adults received non-labor income in 2025, including 37 percent who received interest, dividends, or rental income and 27 percent who received Social Security benefits. (See table 12 for the full list of non-labor income sources considered).21 Even among young adults under age 30, 3 in 10 had at least some non-labor income.
Table 12. Sources of income (by age)
Percent
| Source | 18–29 | 30–44 | 45–59 | 60+ | Overall |
|---|---|---|---|---|---|
| Labor income | |||||
| Wages, salaries, or self-employment | 70 | 82 | 84 | 44 | 68 |
| Non-labor income | |||||
| Interest, dividends, or rental income | 24 | 32 | 37 | 50 | 37 |
| Social Security | 2 | 4 | 9 | 74 | 27 |
| Pension | 1 | 2 | 8 | 49 | 18 |
| SSI, TANF, or cash assistance from a welfare program | 5 | 6 | 6 | 5 | 5 |
| Unemployment income | 4 | 3 | 3 | 2 | 3 |
| Any non-labor income | 30 | 41 | 51 | 91 | 57 |
Note: Among all adults. Respondents could select multiple answers. Sources of income include the income of a spouse or partner. Social Security includes old age and disability insurance. SSI is Supplemental Security Income and TANF is Temporary Assistance for Needy Families.
In addition to cash transfers like Supplemental Security Income (SSI) and Temporary Assistance for Needy Families (TANF) (table 12), government benefits for low-income families may include in-kind assistance for housing and food. Three percent of adults reported that their family received government housing assistance in the prior 12 months, and 16 percent received food assistance (table 13). Parents were more likely to receive food assistance. Just over one-third of parents (of children under age 18) received at least some food assistance, compared with 9 percent of other adults who received support from these programs. Consistent with the majority of parents being ages 30 to 44, and with the majority of adults under age 30 having an income less than $50,000, adults ages 30 to 44 were the most likely to report receiving food assistance (26 percent) followed by those under age 30 (19 percent).
Table 13. Received food or housing assistance from the government (by age)
Percent
| Type of assistance | 18–29 | 30–44 | Overall |
|---|---|---|---|
| Housing assistance | |||
| Housing assistance from government program | 3 | 4 | 3 |
| Food assistance | |||
| Supplemental Nutrition Assistance (SNAP or food stamps) | 16 | 16 | 12 |
| Free or reduced price school lunch | 5 | 15 | 6 |
| Women, Infants, and Children (WIC) nutrition program benefits | 7 | 5 | 3 |
| Any of these forms of government food assistance | 19 | 26 | 16 |
Note: Among all adults. Respondents could select multiple answers.
Financial help from family and friends can be another important source of assistance in making ends meet. Twenty-three percent of adults reported that they received help from someone outside their household to pay an expense in the prior 12 months (table 14). Money for a cell phone bill, for general expenses, and for housing costs—such as rent, mortgage or utilities—were the most common forms of help that people received.22
Table 14. Received help from someone outside the household in paying an expense (by age)
Percent
| Expenses | 18–29 | 30–44 | Overall |
|---|---|---|---|
| Cell phone bill | 30 | 13 | 13 |
| Money for general expenses or anything else | 26 | 15 | 13 |
| Rent, mortgage, utilities, or housing costs | 23 | 14 | 12 |
| Car payment, insurance, or repairs | 19 | 9 | 8 |
| Medical expenses/debt or health insurance | 14 | 6 | 6 |
| Education expenses or student loans | 12 | 3 | 4 |
| Childcare or other expenses for children | 2 | 4 | 2 |
| Received help with any of these expenses | 47 | 26 | 23 |
Note: Among all adults. Respondents could select multiple answers.
Young adults were much more likely to receive assistance with expenses. Forty-seven percent of adults ages 18 to 29 received help from someone outside their household with one of these expenses (table 14). By comparison, just 26 percent of adults ages 30 to 44 and 13 percent of those age 45 and older said they received help with expenses.23
Income Variability
The total level of yearly income may mask variability from month to month, and mismatches between the timing of income and expenses can lead to financial challenges.24 In 2025, most adults had income that was roughly the same each month, but 30 percent had income that varied at least occasionally through the year. This is a similar level of variability to that seen in 2024, although up from 28 percent who reported at least occasional income variability in 2023.
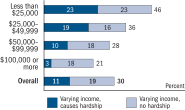
Monthly variations in income caused financial hardship for some families. In 2025, 11 percent of adults reported they struggled to pay their bills in the prior 12 months because their income varied, similar to 2024. Adults with lower family income were more likely to experience income variability and related hardships (figure 17).
Figure 17. Varying income and related hardship (by family income)
Accessible Version | Return to text
Note: Among all adults. Key identifies bars in order from left to right.
Income variability and related hardship were associated with the ways people generated income. Those who were self-employed were more likely to experience income variability and its effects. Among self-employed adults, 58 percent said their income varied from month to month. Twenty-two percent struggled to pay their bills in the prior 12 months because their income varied. Among those who worked for someone else in the month before the survey, a far lower 28 percent reported income variability, and 10 percent struggled to pay bills as a result.25
Income variability was much less common among current retirees. Seventeen percent of retirees said their income varied from month to month, whereas 34 percent of non-retirees said their income varied. A large share of retirees received income from Social Security, and many also had income from pensions and from interest, dividends, or rental income. All of these income sources are associated with less income variability.
Changes in Income, Spending, and Prices
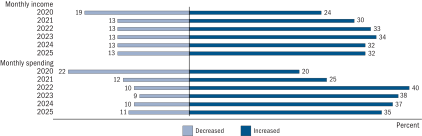
In addition to short-term fluctuations from month-to-month, income and spending can shift substantially from one year to the next. In 2025, 32 percent of adults said their family's monthly income increased from a year earlier, while a higher 35 percent increased their monthly spending (figure 18).
Figure 18. Share with increases and decreases in monthly income and spending from 12 months earlier (by year)
Accessible Version | Return to text
Note: Among all adults. Respondents could also say that their monthly income and spending were about the same as 12 months earlier (not shown). Key identifies bars in order from left to right.
As has been the case for the past several years, the share of adults who said their monthly spending increased year-over-year was larger than the share who said their monthly income increased. That said, the share who said their monthly expenses had increased was down from a high in 2022 and also below the level in 2023 and 2024. The share of adults who said their monthly income increased in 2025 was unchanged from the prior year.26
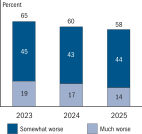
Rising prices can contribute to increases in spending, and most adults said that price increases in the past year made their financial situation at least somewhat worse. Fifty-eight percent said that changes in the prices they paid compared with the prior year had made their financial situation worse, including 14 percent who said price changes had made their financial situation much worse. This compares with 7 percent who said that price changes compared with the prior year had made their financial situation better. Thirty-six percent of adults said overall changes in the prices they paid had little to no effect on their financial situation in the last year. While a majority of adults continued to report that price changes have made their finances somewhat or much worse, the share saying so has declined by 7 percentage points since 2023 (figure 19).
Figure 19. Changes in prices paid compared with last year made financial situation worse (by year)
Accessible Version | Return to text
Note: Among all adults. Key identifies bars in order from top to bottom.
The share who said that price changes made their financial situation worse was somewhat higher among adults with income under $50,000 (table 15). Hispanic adults, adults with a disability, and middle-aged adults were also more likely to say that changes in prices they paid compared with a year ago had made their financial situation worse.
Table 15. Changes in prices paid compared with last year made financial situation worse (by demographic characteristics)
Percent
| Characteristic | 2025 | 1-year change (since 2024) |
|---|---|---|
| Family income | ||
| Less than $25,000 | 62 | 2 |
| $25,000–$49,999 | 64 | −4 |
| $50,000–$99,999 | 58 | −6 |
| $100,000 or more | 53 | 0 |
| Age | ||
| 18–29 | 55 | −1 |
| 30–44 | 64 | 2 |
| 45–59 | 60 | −5 |
| 60+ | 52 | −4 |
| Race/ethnicity | ||
| White | 56 | −5 |
| Black | 56 | 7 |
| Hispanic | 62 | 2 |
| Asian | 56 | 3 |
| Disability status | ||
| Disability | 64 | −1 |
| No disability | 56 | −2 |
| Metropolitan status | ||
| Metro area | 58 | −1 |
| Non-metro area | 57 | −9 |
| Overall | 58 | −2 |
Note: Among all adults. Share saying financial situation was made worse includes those who said it was made somewhat or much worse.
Demographic groups varied in how the share who said that price changes had made their finances worse compared with that seen in 2024 (table 15). For example, the share of adults living in non-metro areas who said that changes in prices had made their finances worse registered a sizeable decrease from the prior year—far larger than the decline observed among residents in metro areas.27 This variation across groups in the one-year change in this measure is in contrast with 2024 when the share of adults who said that price changes made them worse off financially decreased across a broad range of demographic groups.28
Most people adjusted behaviors in response to higher prices. The most common actions were spending changes, including switching to a cheaper product (62 percent of adults), using less of or stopping using a product (60 percent), or delaying a major purchase (46 percent) (table 16). Forty-one percent of adults reported they reduced savings. Increasing borrowing was less common, as were activities to generate additional income, such as working more or asking for a raise.
Table 16. Actions taken in response to higher prices in prior 12 months
Percent
| Action | 2025 | 1-year change (since 2024) | 3-year change (since 2022) |
|---|---|---|---|
| Spending | |||
| Switched to cheaper products | 62 | −1 | −1 |
| Used less or stopped using products | 60 | −2 | −7 |
| Delayed a major purchase | 46 | −1 | −4 |
| Saving/borrowing | |||
| Reduced saving | 41 | −2 | −10 |
| Increased borrowing | 16 | 0 | 1 |
| Income | |||
| Worked more or got another job | 17 | −1 | −1 |
| Asked for a raise | 7 | −1 | −1 |
| Took any action of these actions | 77 | −2 | −5 |
Note: Among all adults. Respondents could select multiple answers.
Overall, 77 percent of adults took some action in response to higher prices—down slightly from 2024 and lower than in 2022 when the question was first asked. Compared with 2022, the actions that showed the largest declines were reducing savings and spending-related actions such as using less of a product or delaying a major purchase.
Expectations about future prices can also influence spending decisions. The 2025 SHED included a new question asking whether people had made a major purchase earlier than planned because of expected price increases. Eighteen percent of adults indicated that in the prior 12 months they made a major purchase sooner than planned because they expected prices to increase. There was little variation in the timing of purchases by income for groups with income of less than $100,000. However, expediting of a major purchase was slightly more common among those with an income of $100,000 or more, compared with those in lower income groups (table 17).
Table 17. Made a major purchase earlier than planned because expected prices to increase (by family income)
| Family income | Percent |
|---|---|
| Less than $25,000 | 16 |
| $25,000–$49,999 | 17 |
| $50,000–$99,999 | 17 |
| $100,000 or more | 19 |
| Overall | 18 |
Note: Among all adults.
Spending Relative to Income
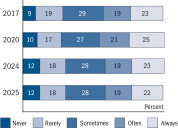
Having money left over at the end of the month can be a sign that families have some margin in their budgets. In 2025, 41 percent of adults said they always or often had money left over at the end of the month, similar to 2024 (figure 20).29
Figure 20. How often have money left over at end of month (by year)
Accessible Version | Return to text
Note: Among all adults. Question was not asked in 2018–19 or 2021–23. Key identifies bars in order from left to right.
Having money left over at the end of the month was less common for lower-income adults, likely reflecting their more limited budgets. Nineteen percent of adults with income less than $25,000 said they always or often had money left over at the end of the month, compared with 59 percent of adults with an income of $100,000 or more (table 18).
Table 18. How often have money left over at the end of the month (by family income)
Percent
| Family income | Never | Rarely | Sometimes | Often | Always |
|---|---|---|---|---|---|
| Less than $25,000 | 29 | 25 | 27 | 10 | 10 |
| $25,000–$49,999 | 19 | 25 | 31 | 13 | 13 |
| $50,000–$99,999 | 9 | 20 | 33 | 20 | 18 |
| $100,000 or more | 4 | 11 | 25 | 25 | 34 |
| Overall | 12 | 18 | 28 | 19 | 22 |
Note: Among all adults.
References
21. Non-labor income does not include in-kind benefits or tax credits such as the Earned Income Tax Credit. Details on these sources are available in table 13 and in appendix B of this report. It also does not include respondents who reported receiving income but did not specify the source. Return to text
22. This question was new in 2025. While not directly comparable to the 2025 question, earlier surveys (2017–20) included different questions asking about the receipt of "regular financial support" from anyone living outside the household. Return to text
23. Based on earlier years of the survey, parents are a likely source of assistance. In the 2018 SHED, 64 percent of those receiving regular financial support said their parents provided at least some of it. See appendix B of Board of Governors of the Federal Reserve System, Report on the Economic Well-Being of U.S. Households in 2018 (Washington: Board of Governors, May 2019), https://www.federalreserve.gov/publications/files/2018-supplement-economic-well-being-us-households-201905.pdf. Return to text
24. For additional information on monthly income variability, see Jonathan Morduch and Julie Siwicki, "In and Out of Poverty: Episodic Poverty and Income Volatility in the U.S. Financial Diaries," Social Service Review 91, no. 3 (2017): 390–421, https://doi.org/10.1086/694180. Return to text
25. Self-employed adults were more likely to have lower incomes, compared with those who worked for someone else, which may contribute to the association between self-employment and difficulties paying bills because of varying income. Yet after controlling for income, self-employed adults still were more likely to experience hardships due to income variability than those who work for someone else. Return to text
26. The large share of adults who experienced increases in their income from year to year is consistent with findings based on Internal Revenue Service tax records data from Jeff Larrimore, Jacob Mortenson, and David Splinter, "Earnings Business Cycles: The Covid Recession, Recovery, and Policy Response," Journal of Public Economics 225 (September 2023): 104,983, https://doi.org/10.1016/j.jpubeco.2023.104983. The authors also note that this is not unique to recent years. Return to text
27. Analysis from the Federal Reserve Bank of New York looking at inflation rates for different demographic groups indicates inflation for people living in rural areas was lower than that experienced by people living in urban areas from the middle of 2023 through the middle of 2025. Transportation costs are a larger share of expenses for people living in rural areas, and transportation inflation hit recent highs in 2021 and 2022, declining in 2023. See Rajashri Chakrabarti, Natalia Emanuel, Thu Pham, Beck Pierce, and Maxim Pinkovski, Economic Heterogeneity Indicators—National, Federal Reserve Bank of New York, February 3, 2026, https://www.newyorkfed.org/medialibrary/research/interactives/data/economic-heterogeneity-indicators/downloads/12-2025_ehi_national_full.pdf?sc_lang=en&hash=9ED1DF9F83095FAE63BA1946341924C9. Return to text
28. See table 15 in Board of Governors of the Federal Reserve System, Economic Well-Being of U.S. Households in 2024 (Washington: Board of Governors, May 2025), https://doi.org/10.17016/8960.1. Return to text
29. The question about money left over at the end of the month was used by the Consumer Financial Protection Bureau (CFPB) as part of their' "financial well-being score." The five-question version of the CFPB's financial well-being scale was included on the SHED in 2017, 2020, 2024, and 2025. See Financial Well-Being in America(September 2017), www.consumerfinance.gov/documents/5606/201709_cfpb_financial-well-being-in-America.pdf, for details on the development of these questions and their relation to material hardships. Return to text